Police Incident Patterns and Response Time Modeling in Montgomery County, MD
End-to-end data science project analyzing 300K+ police dispatch records to predict response times, classify call priorities, and identify incident hotspots across Montgomery County, MD. Built regression, classification, and clustering models with interactive visualizations deployed on a Quarto website.

Overview
This project investigates police dispatch patterns and emergency response times in Montgomery County, Maryland using real-world data from the county's open data API. The analysis covers 16,782 incident records with 26 variables spanning call types, priority levels, timestamps, geographic coordinates, and disposition outcomes.
The project follows a complete data science pipeline — data collection, cleaning, exploratory analysis, unsupervised learning, and supervised learning — answering questions like what drives response times, whether spatial clusters exist, and how accurately we can predict call priority and disposition outcomes.
Data Cleaning
The raw dataset required extensive cleaning — parsing numeric fields, handling missing values, normalizing categorical labels, and using the Google Geocoding API to fill missing coordinates. Two separate cleaned datasets were produced: one preserving the original structure for exploratory analysis, and a second with z-score normalization and categorical encoding for machine learning.
A major challenge was the large number of missing geographic coordinates. Since each incident record included a street address, the Google Geocoding API was used to recover accurate longitude and latitude values — enabling the spatial analysis that would later reveal geographic incident patterns across the county.
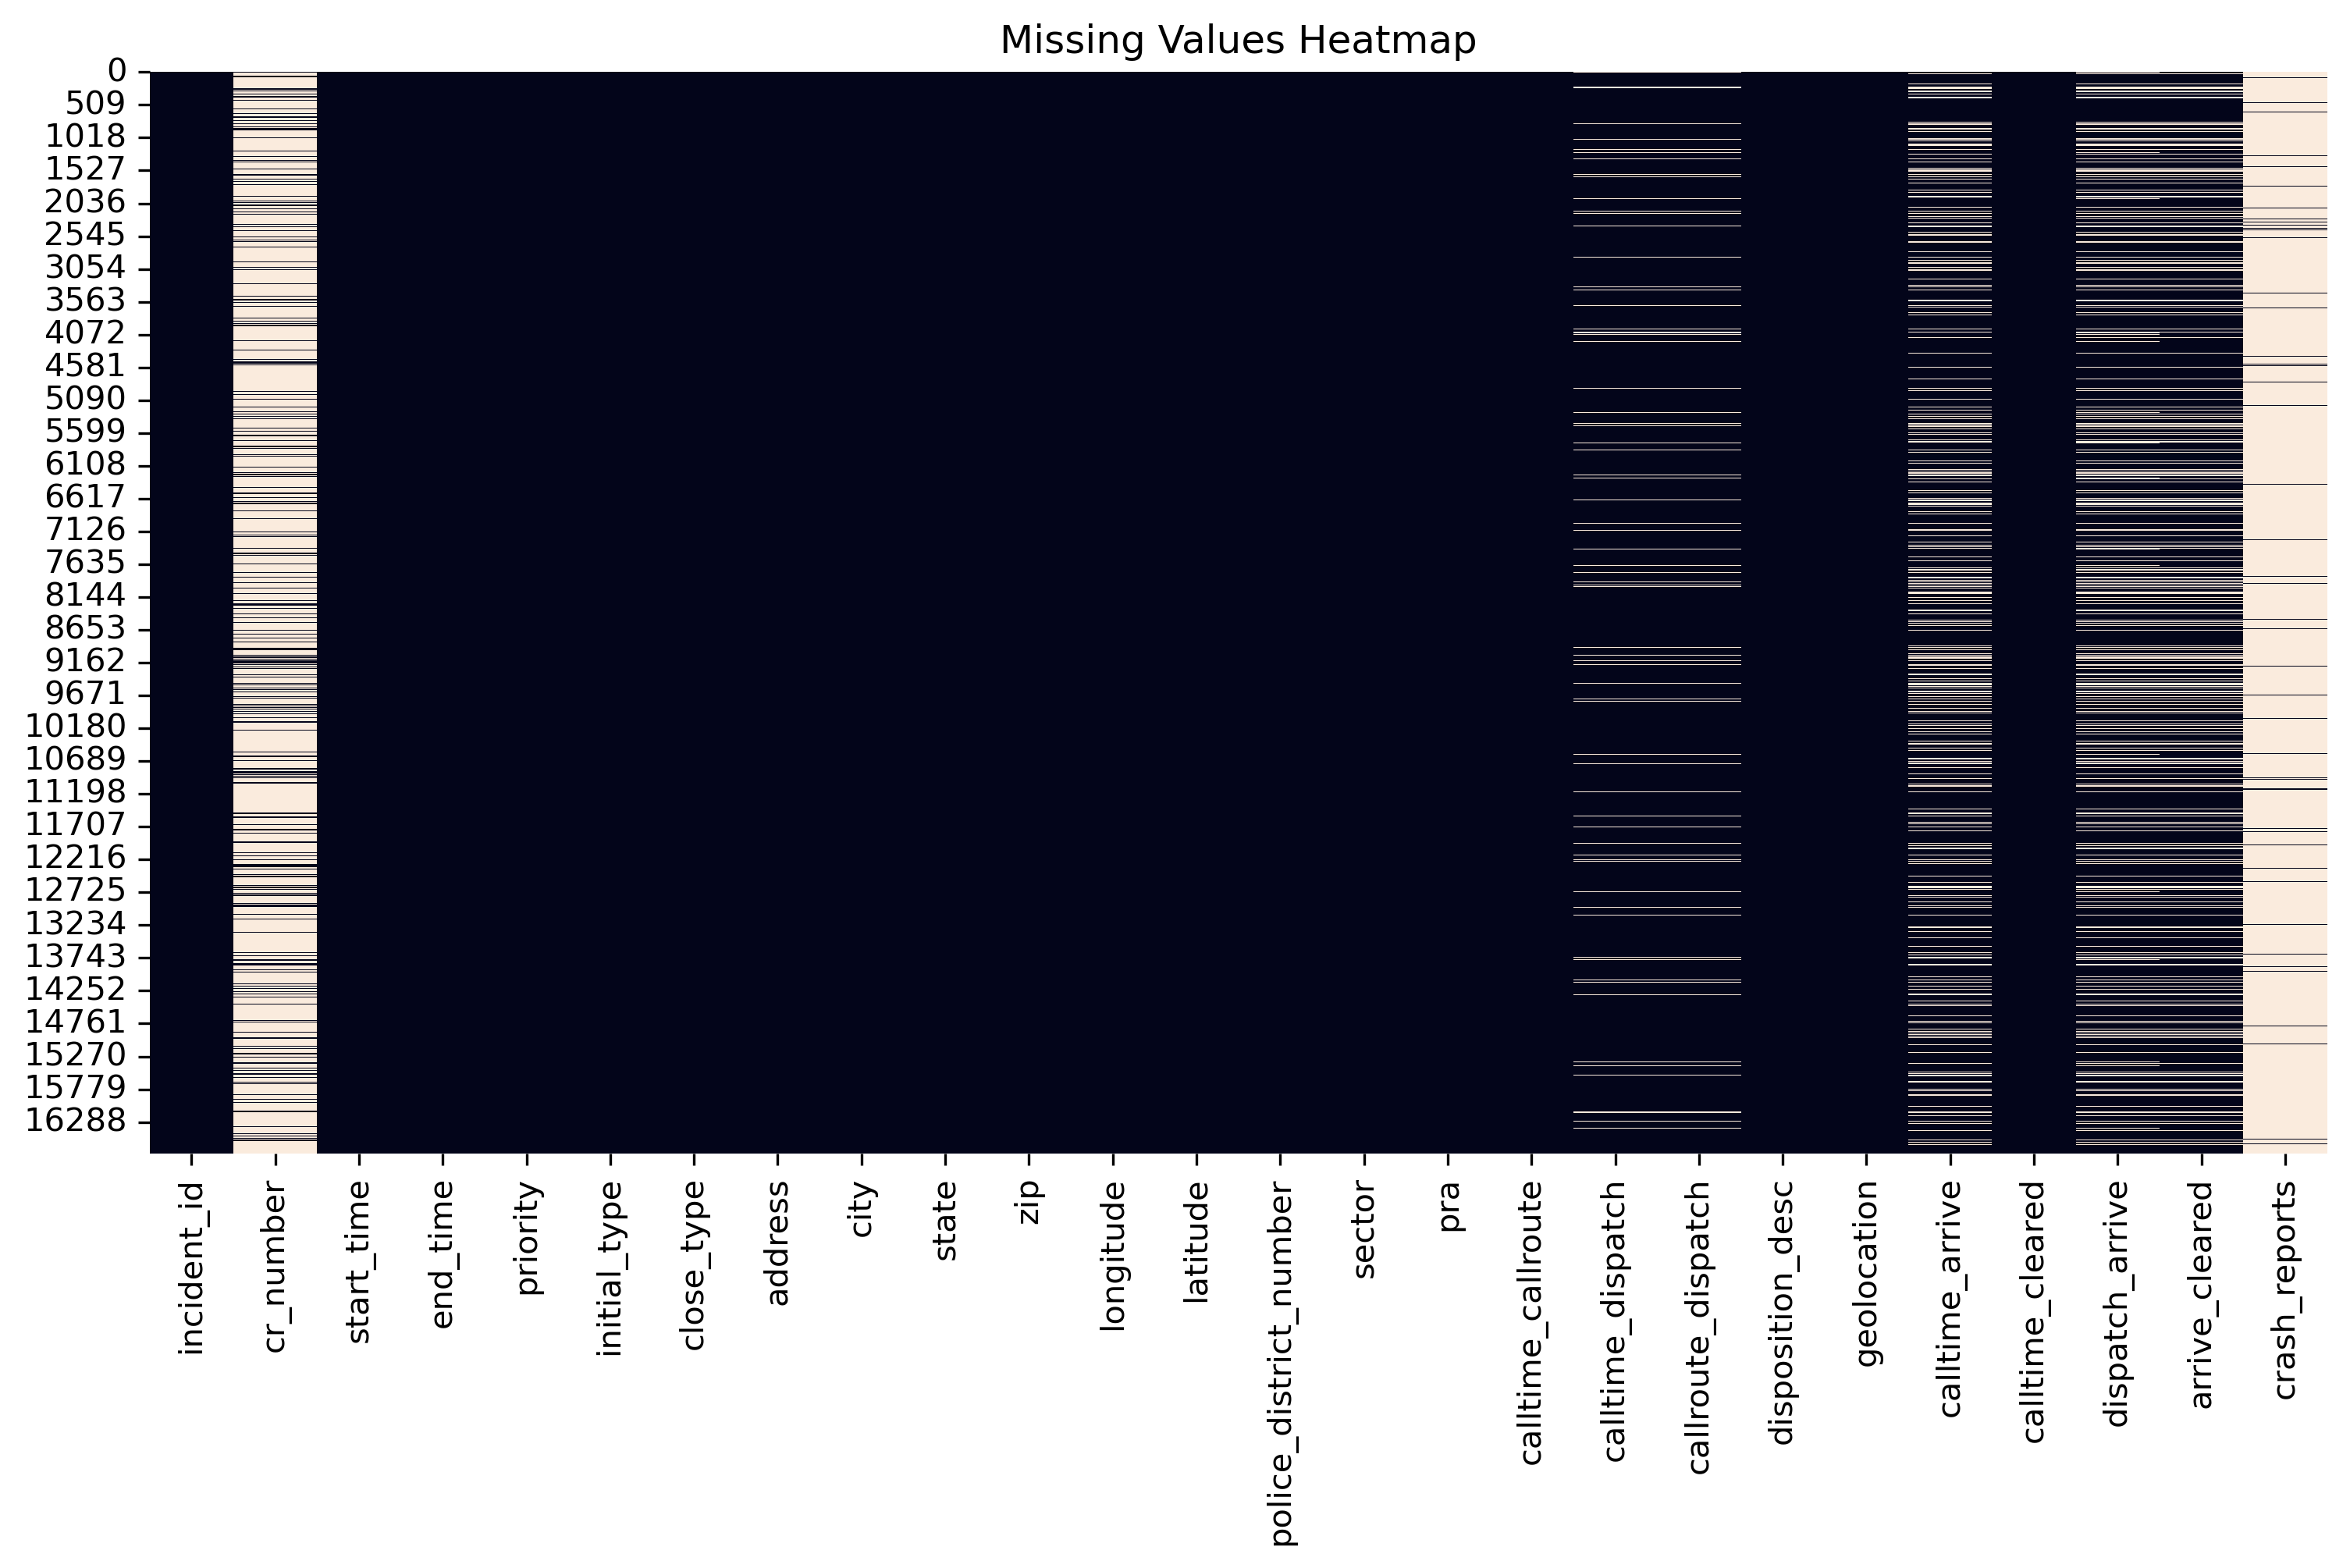
Missing Values Heatmap Across 26 Variables
Exploratory Data Analysis
The EDA examined both individual variables and cross-variable relationships. Time-related measures like call-to-dispatch and dispatch-to-arrival are highly right-skewed — most incidents are handled quickly, but a small number take significantly longer, creating extreme outliers. These delays were found to accumulate across the workflow rather than occurring in isolation.
Property crime is the most frequent incident type and is prominent among high-priority calls alongside violent crime and health & safety incidents. Temporal patterns show most incident types peaking around 4 PM, with public order incidents spiking late at night on weekends. The Silver Spring district (3D) stands out with the highest property crime concentration, while nighttime incidents generally have shorter response times despite lower overall volume.
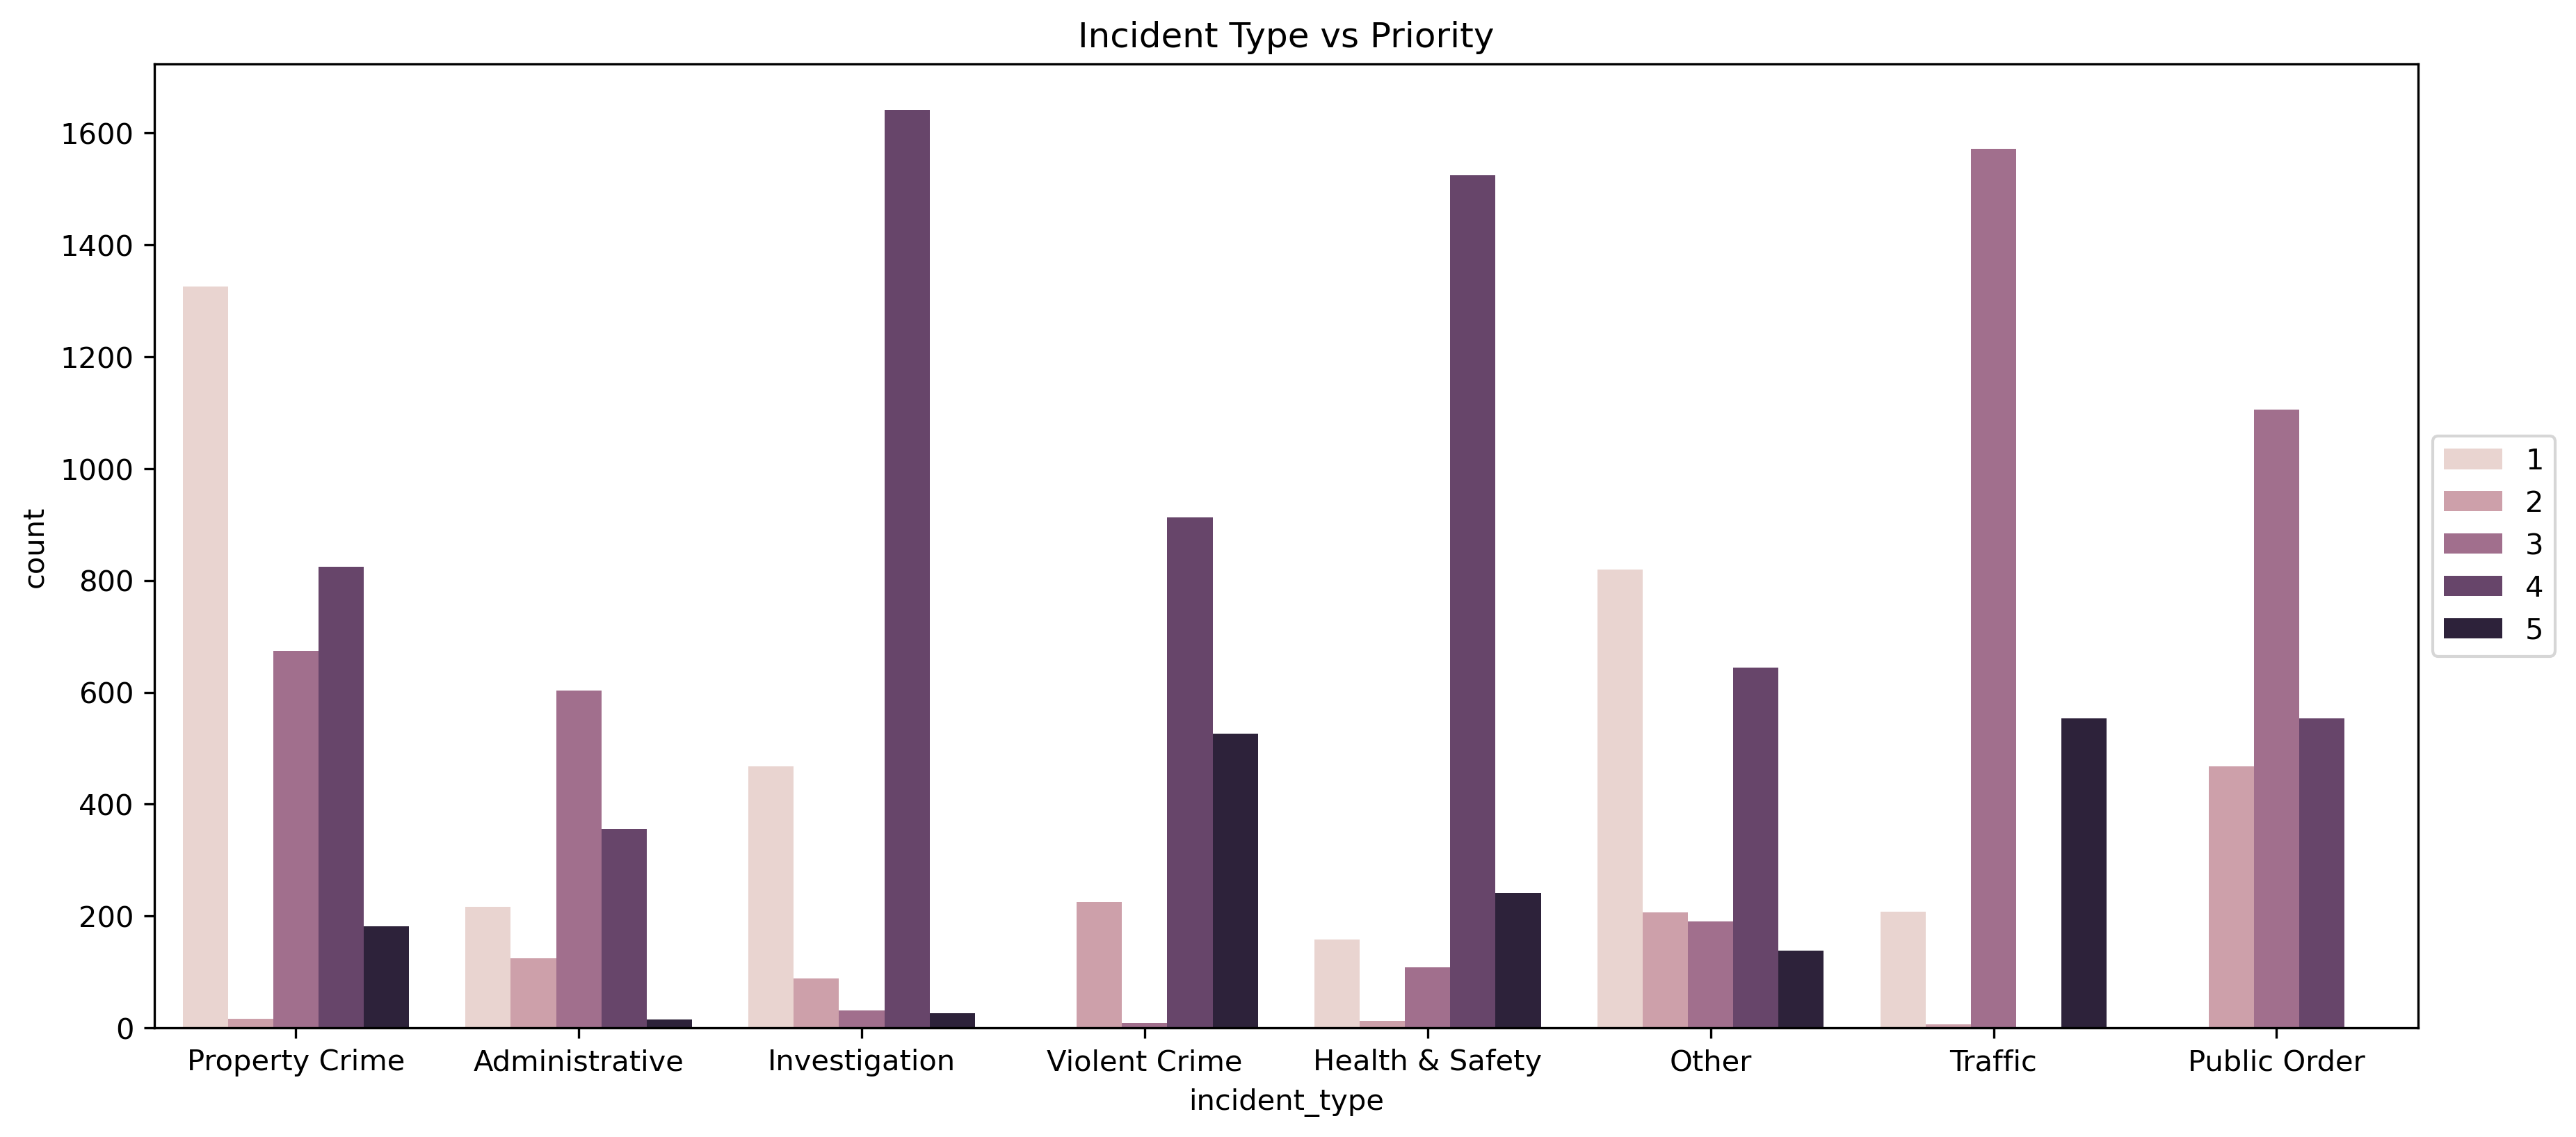
Incident Type vs Priority Distribution
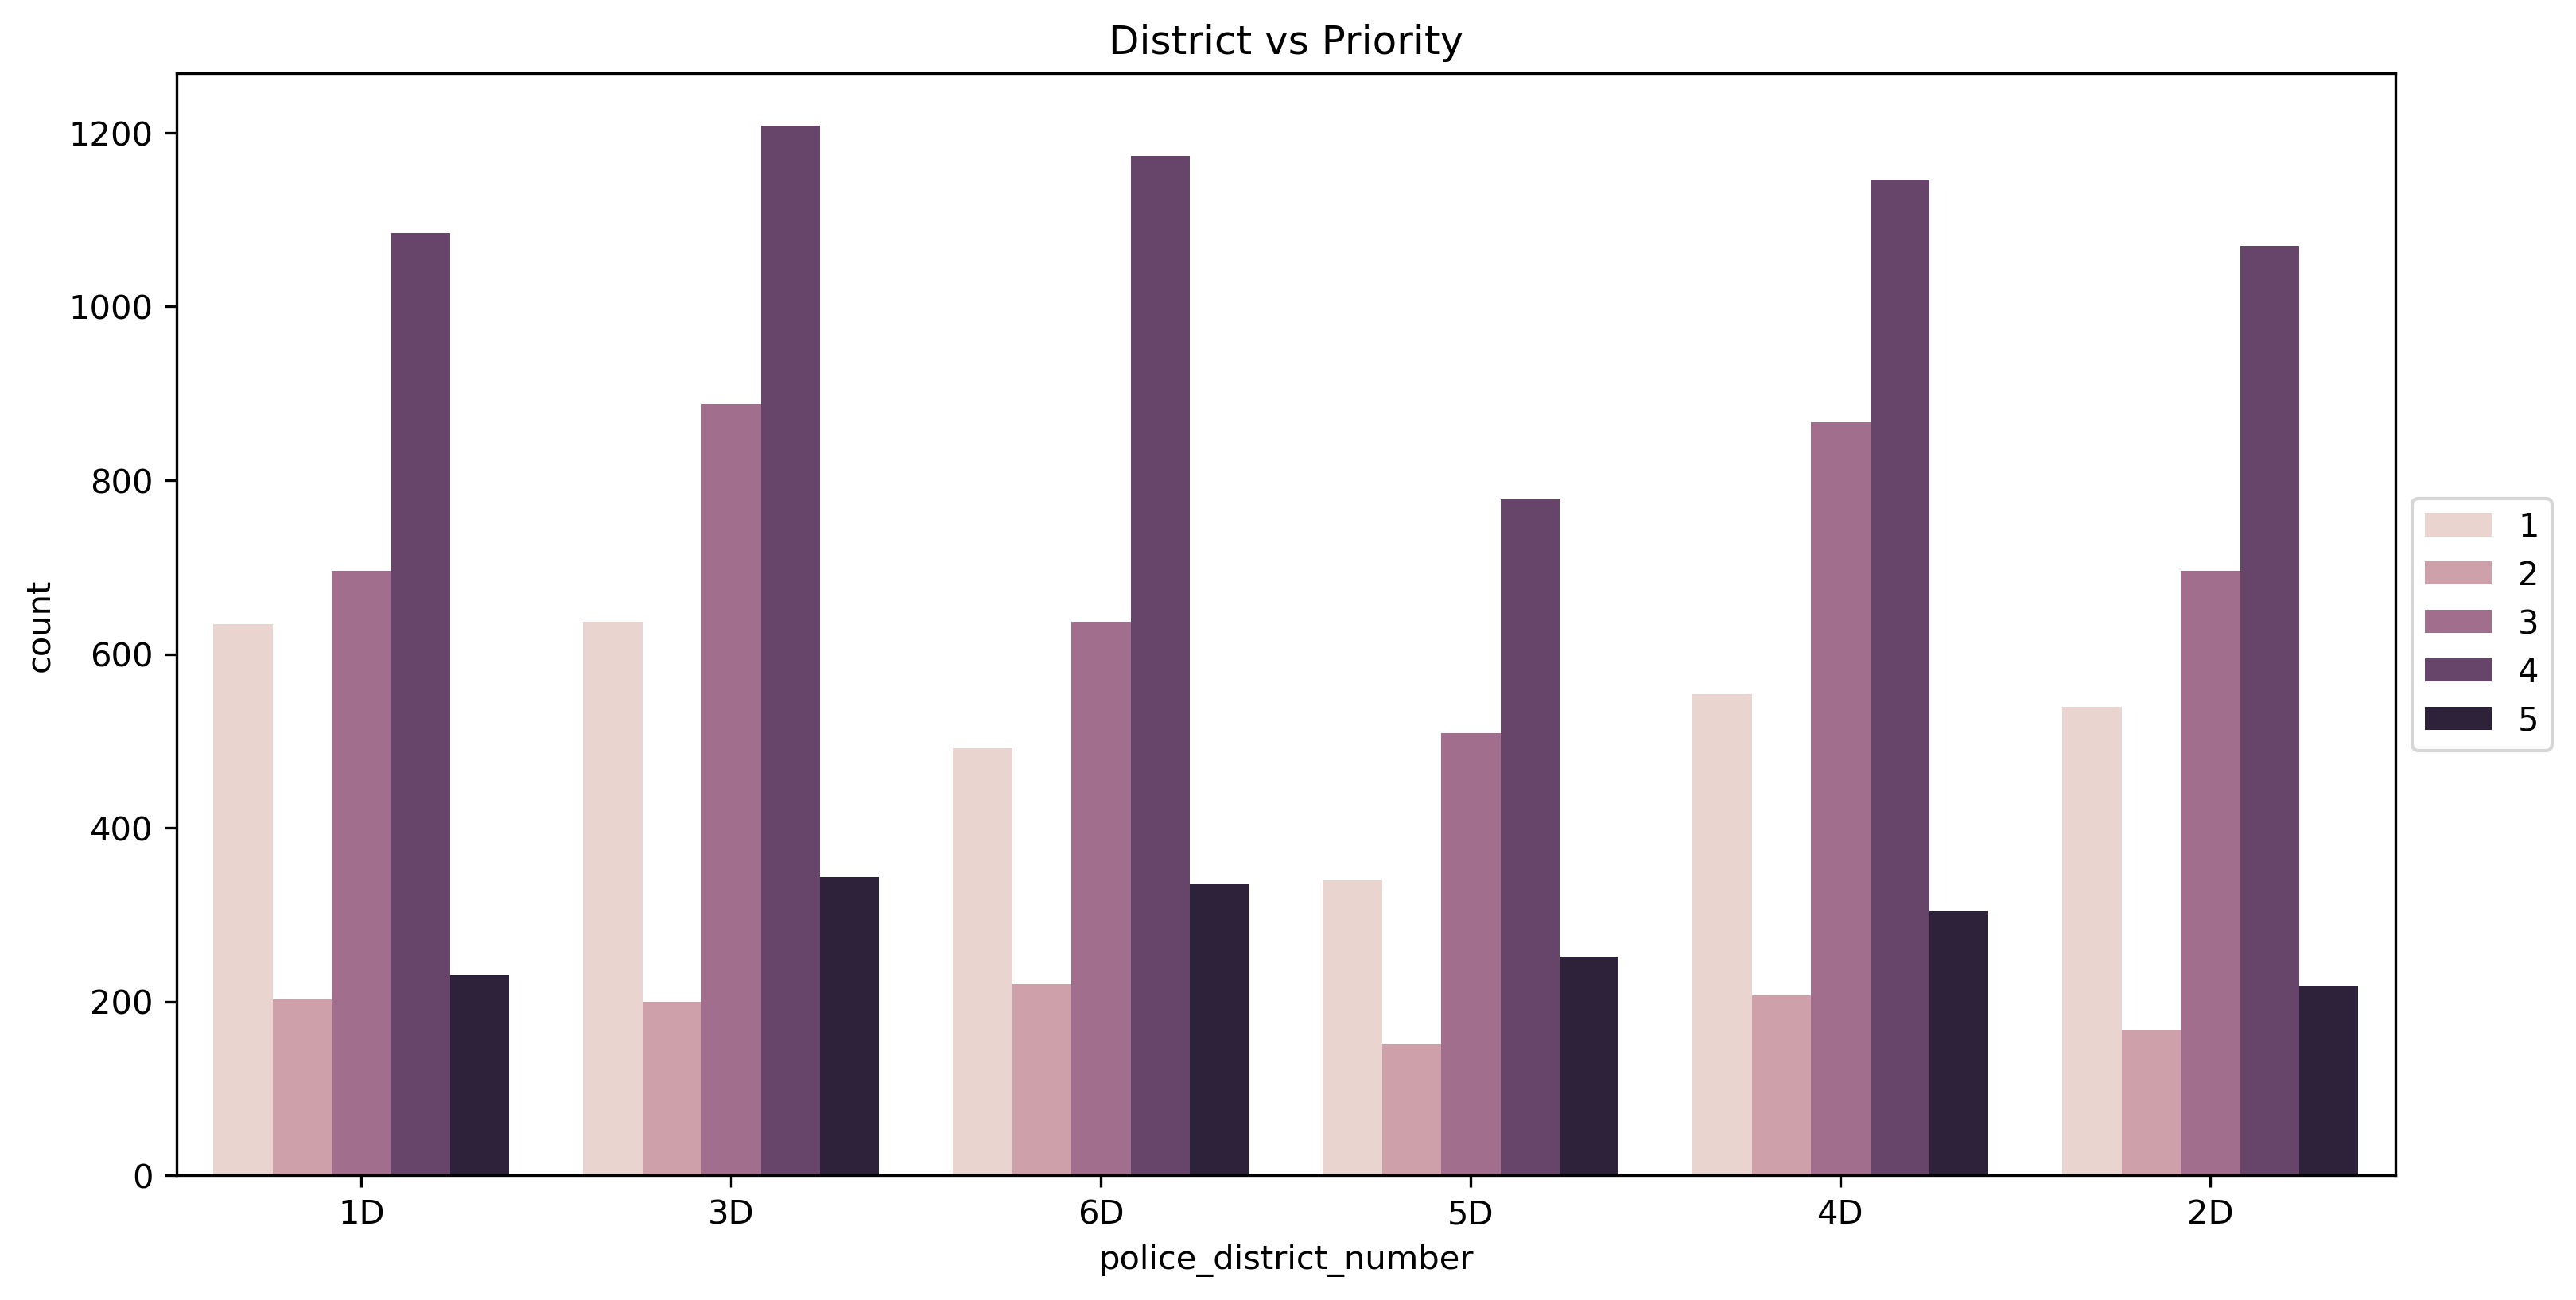
District vs Priority Distribution
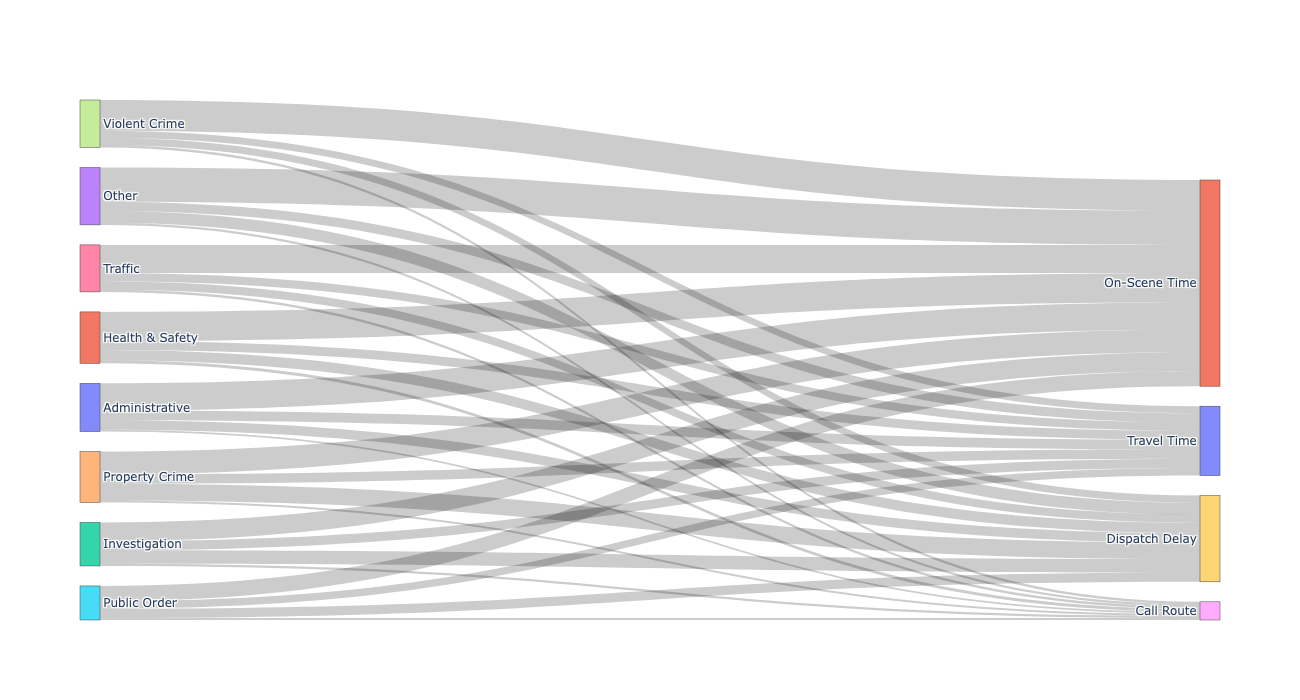
Operational Delay Breakdown by Incident Type
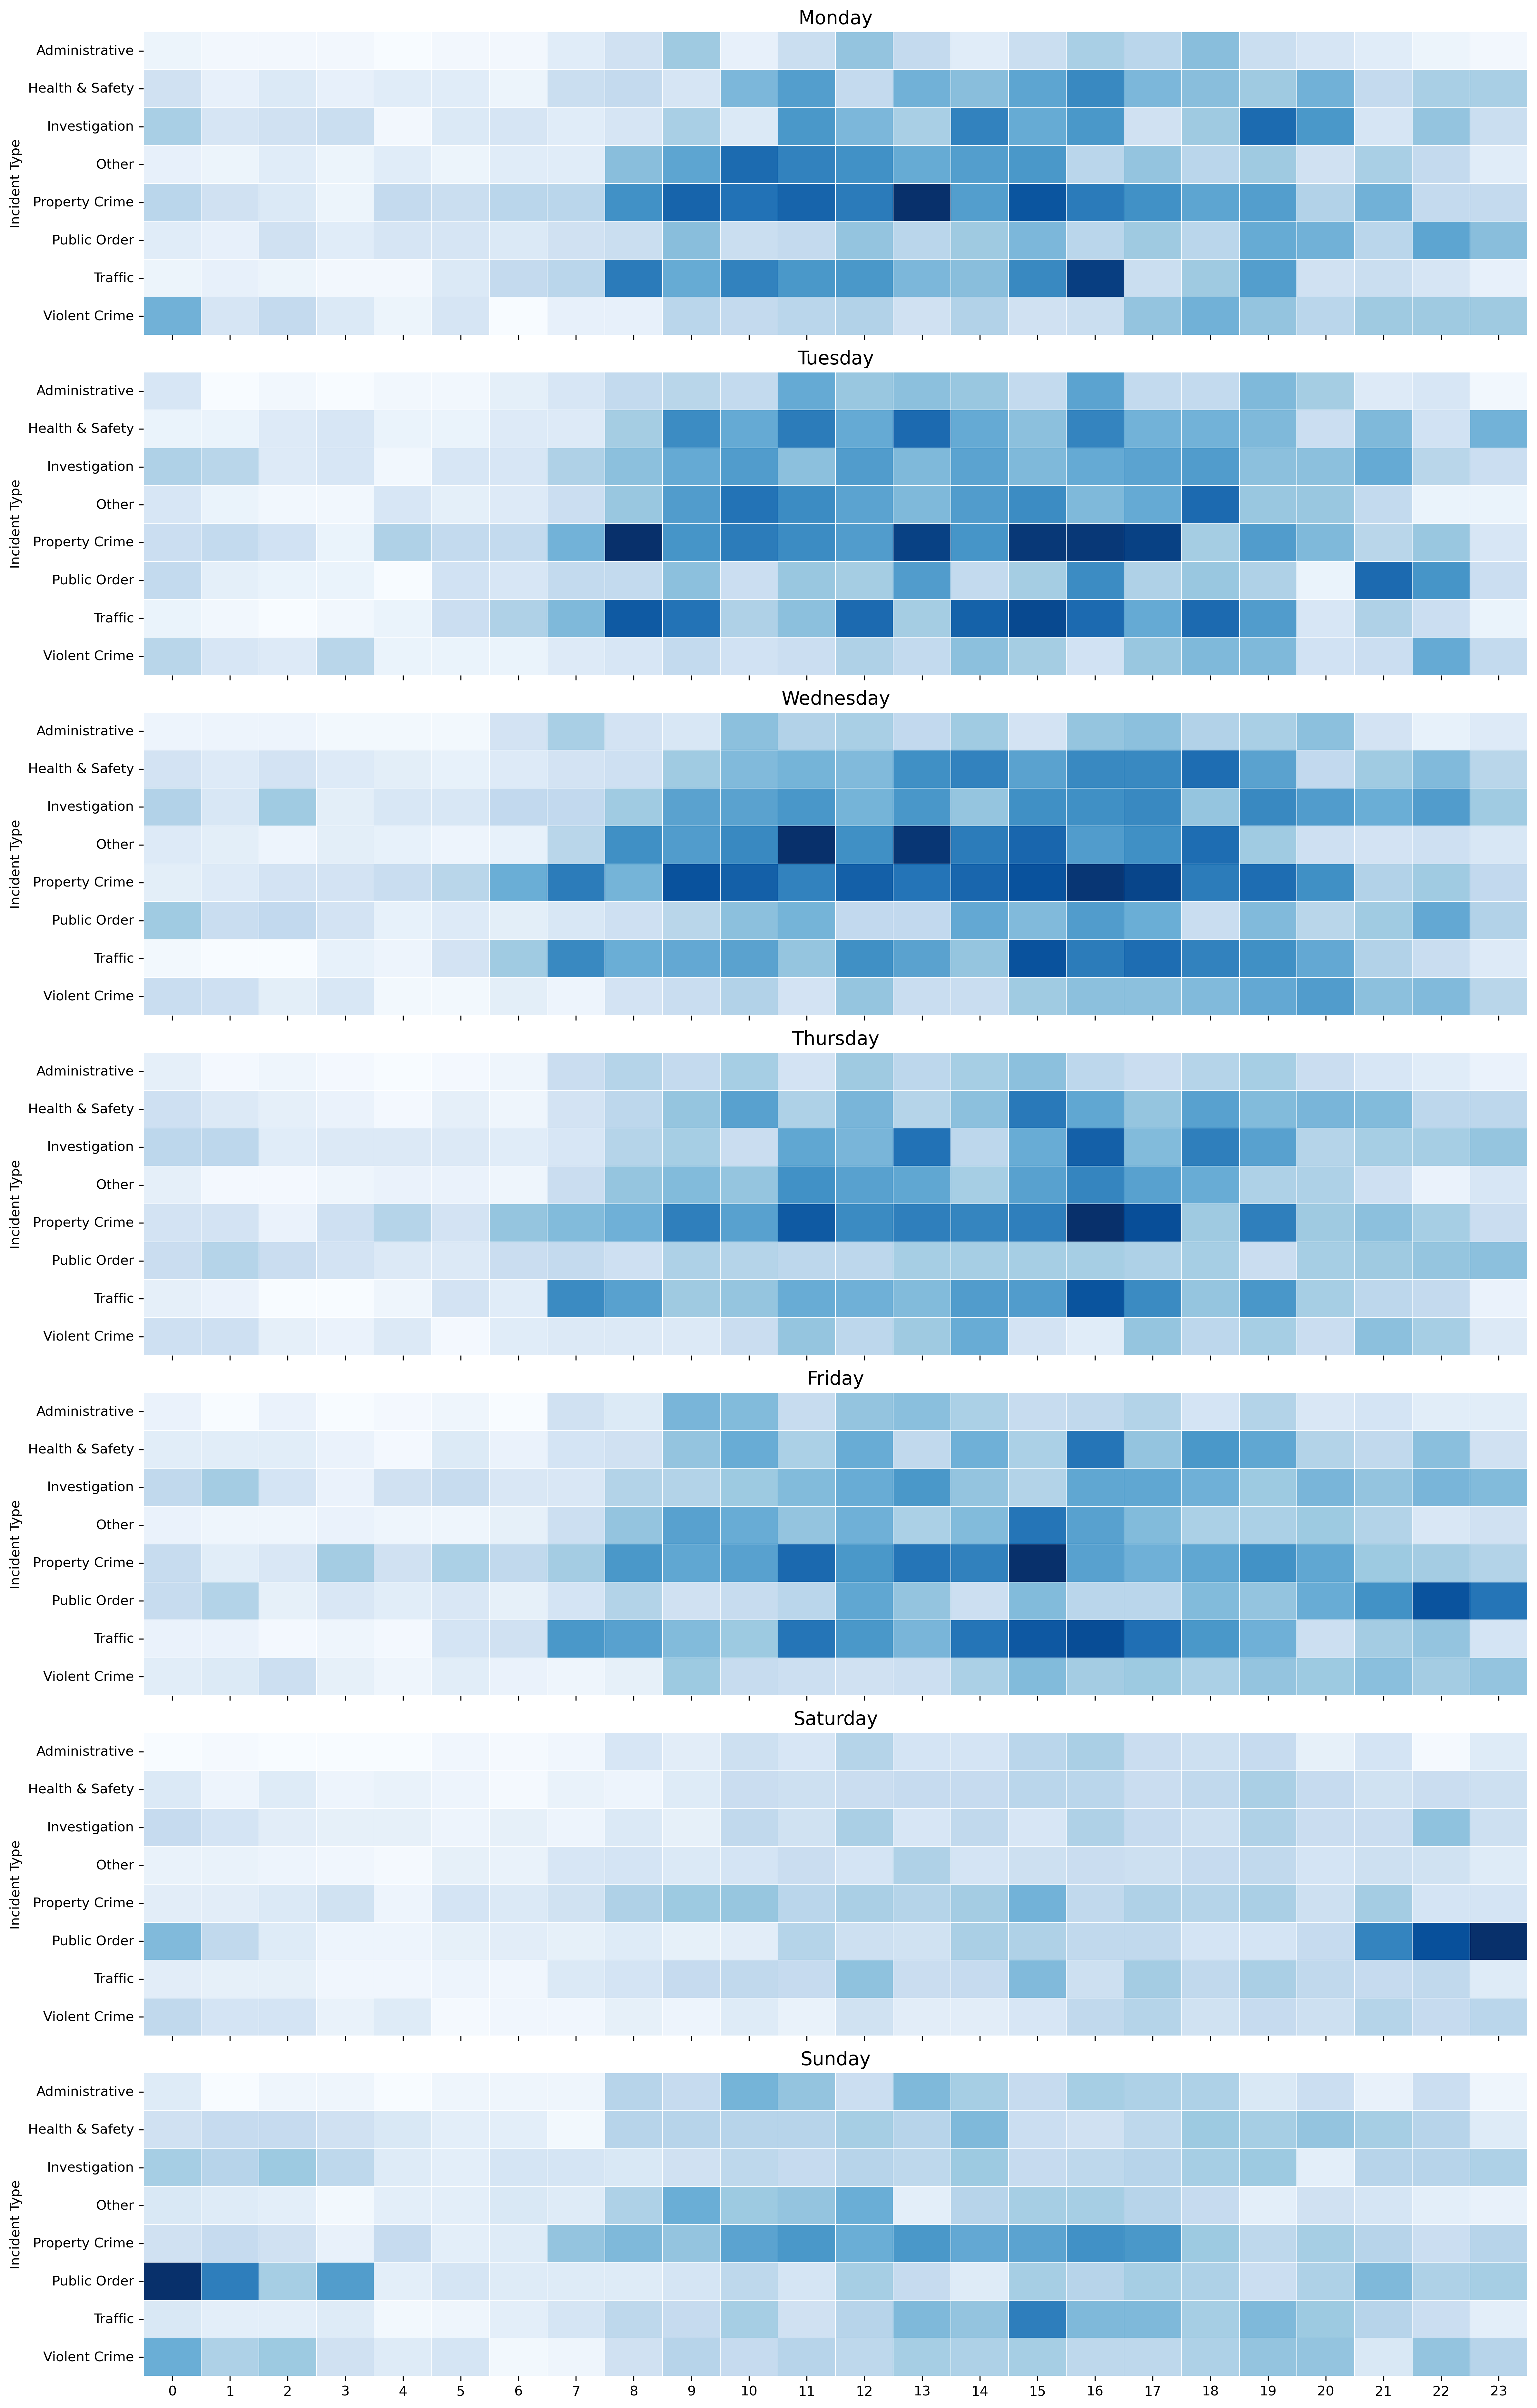
Daily Incident Heatmap — Hourly Patterns by Day of Week
Unsupervised Learning
Dimensionality reduction using PCA and t-SNE projected the 26-variable dataset into two dimensions for visualization. Clustering algorithms — K-Means, DBSCAN, and Hierarchical Clustering — were applied with varying parameter settings and distance functions to search for natural groupings.
The results consistently showed that incidents form a single dense cloud with smooth transitions between types and priorities. While algorithms can force partitions, the boundaries don't reflect meaningful operational differences — they cut across incident types without clear interpretive value. This suggests response times are driven by factors unique to each individual incident rather than by broad categorical groupings.
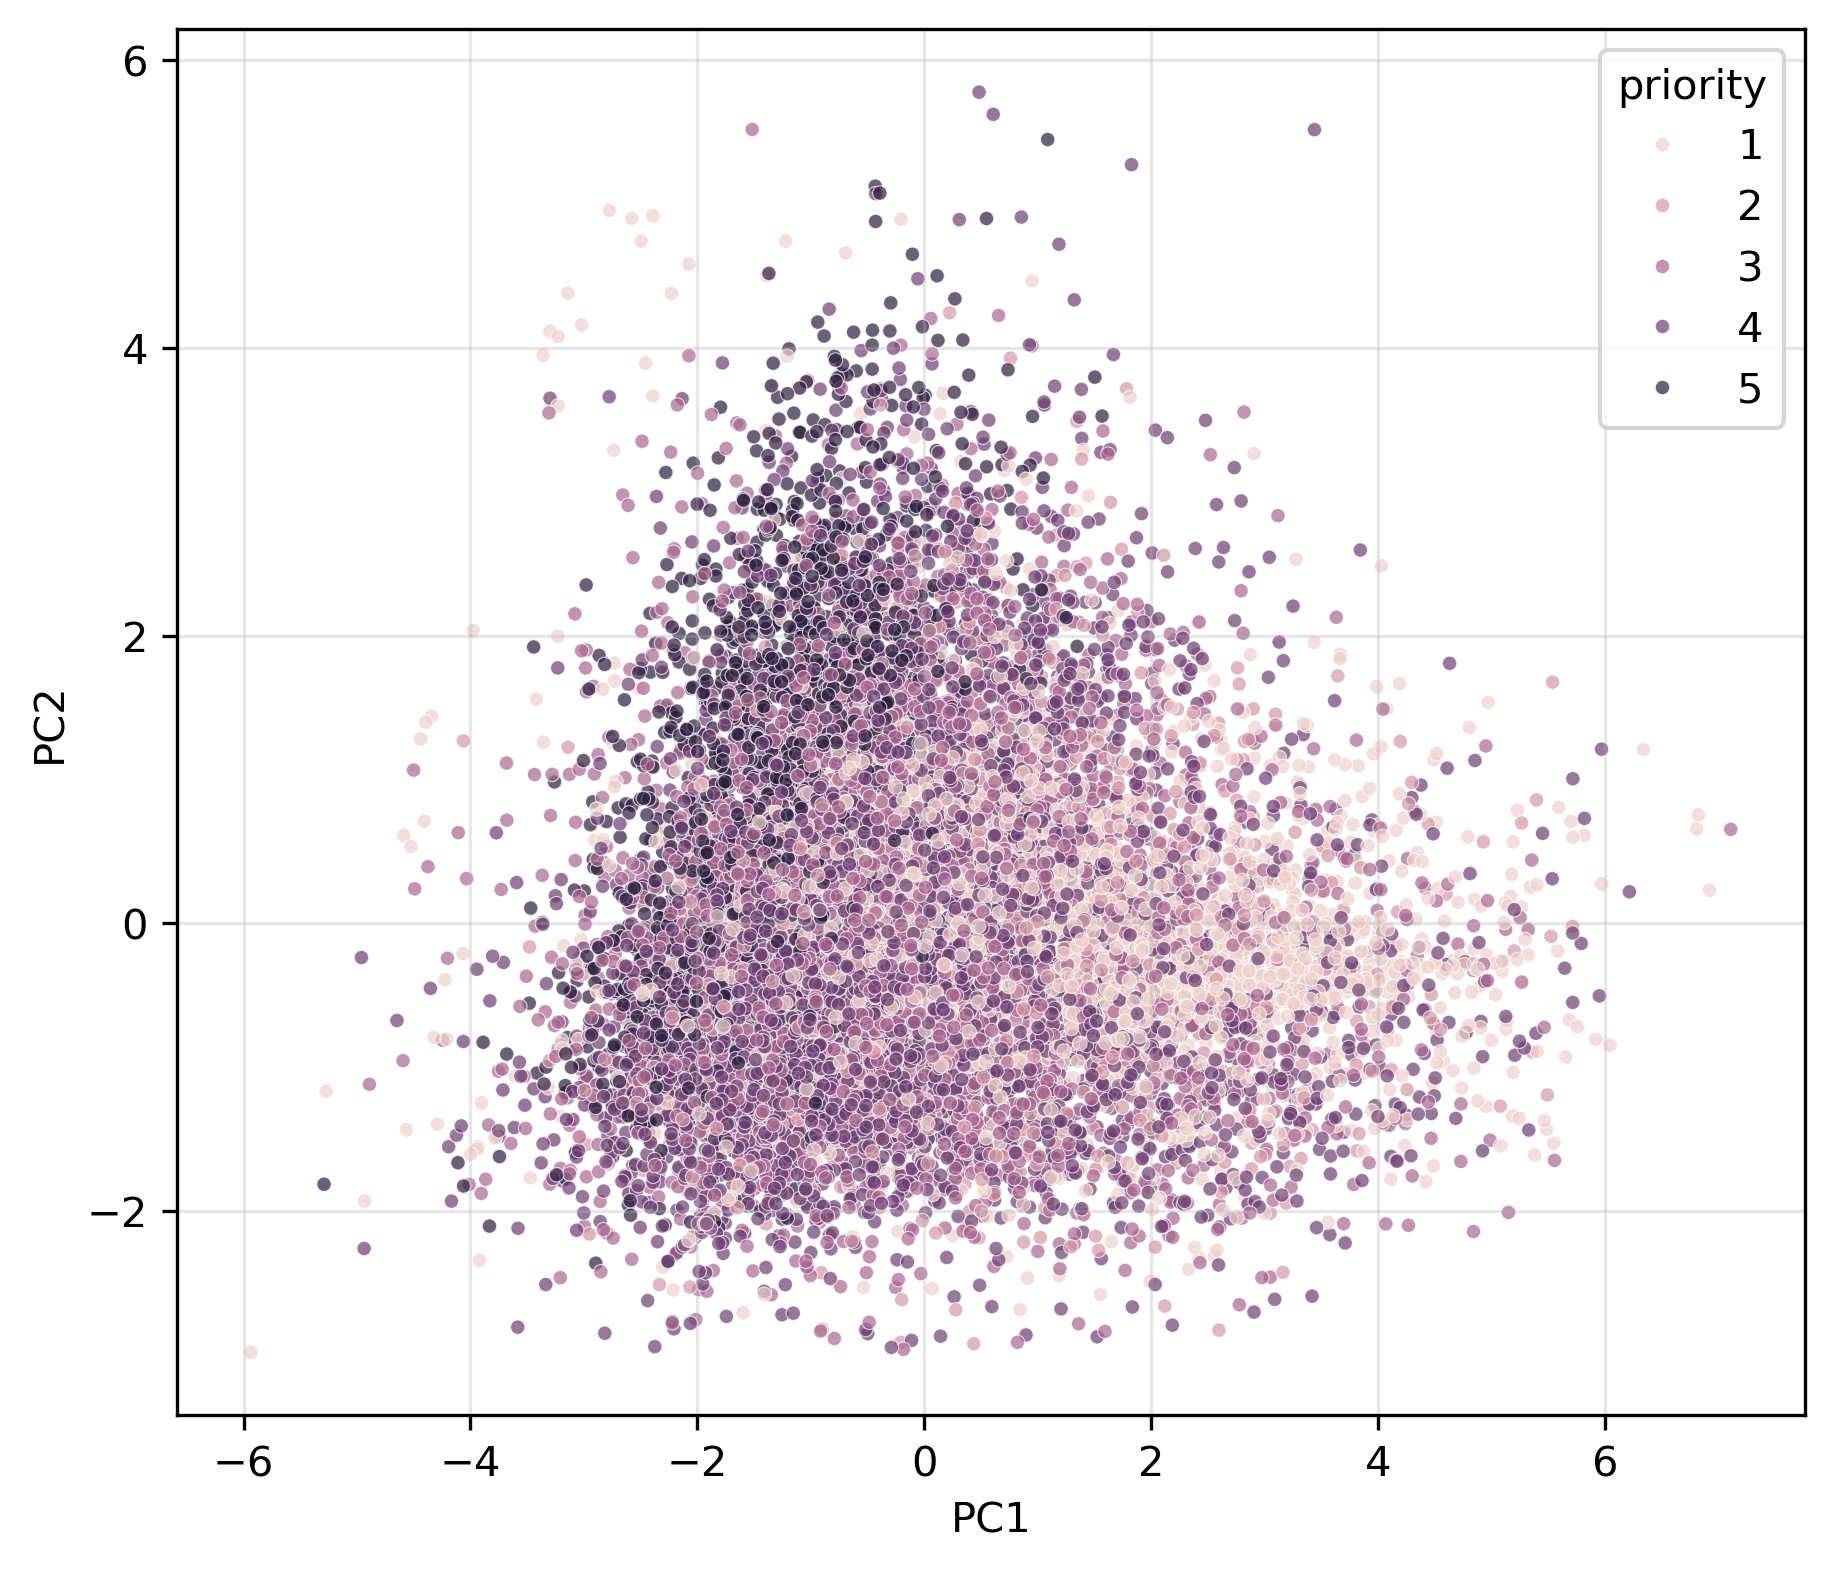
PCA Scatter Plot by Priority Level
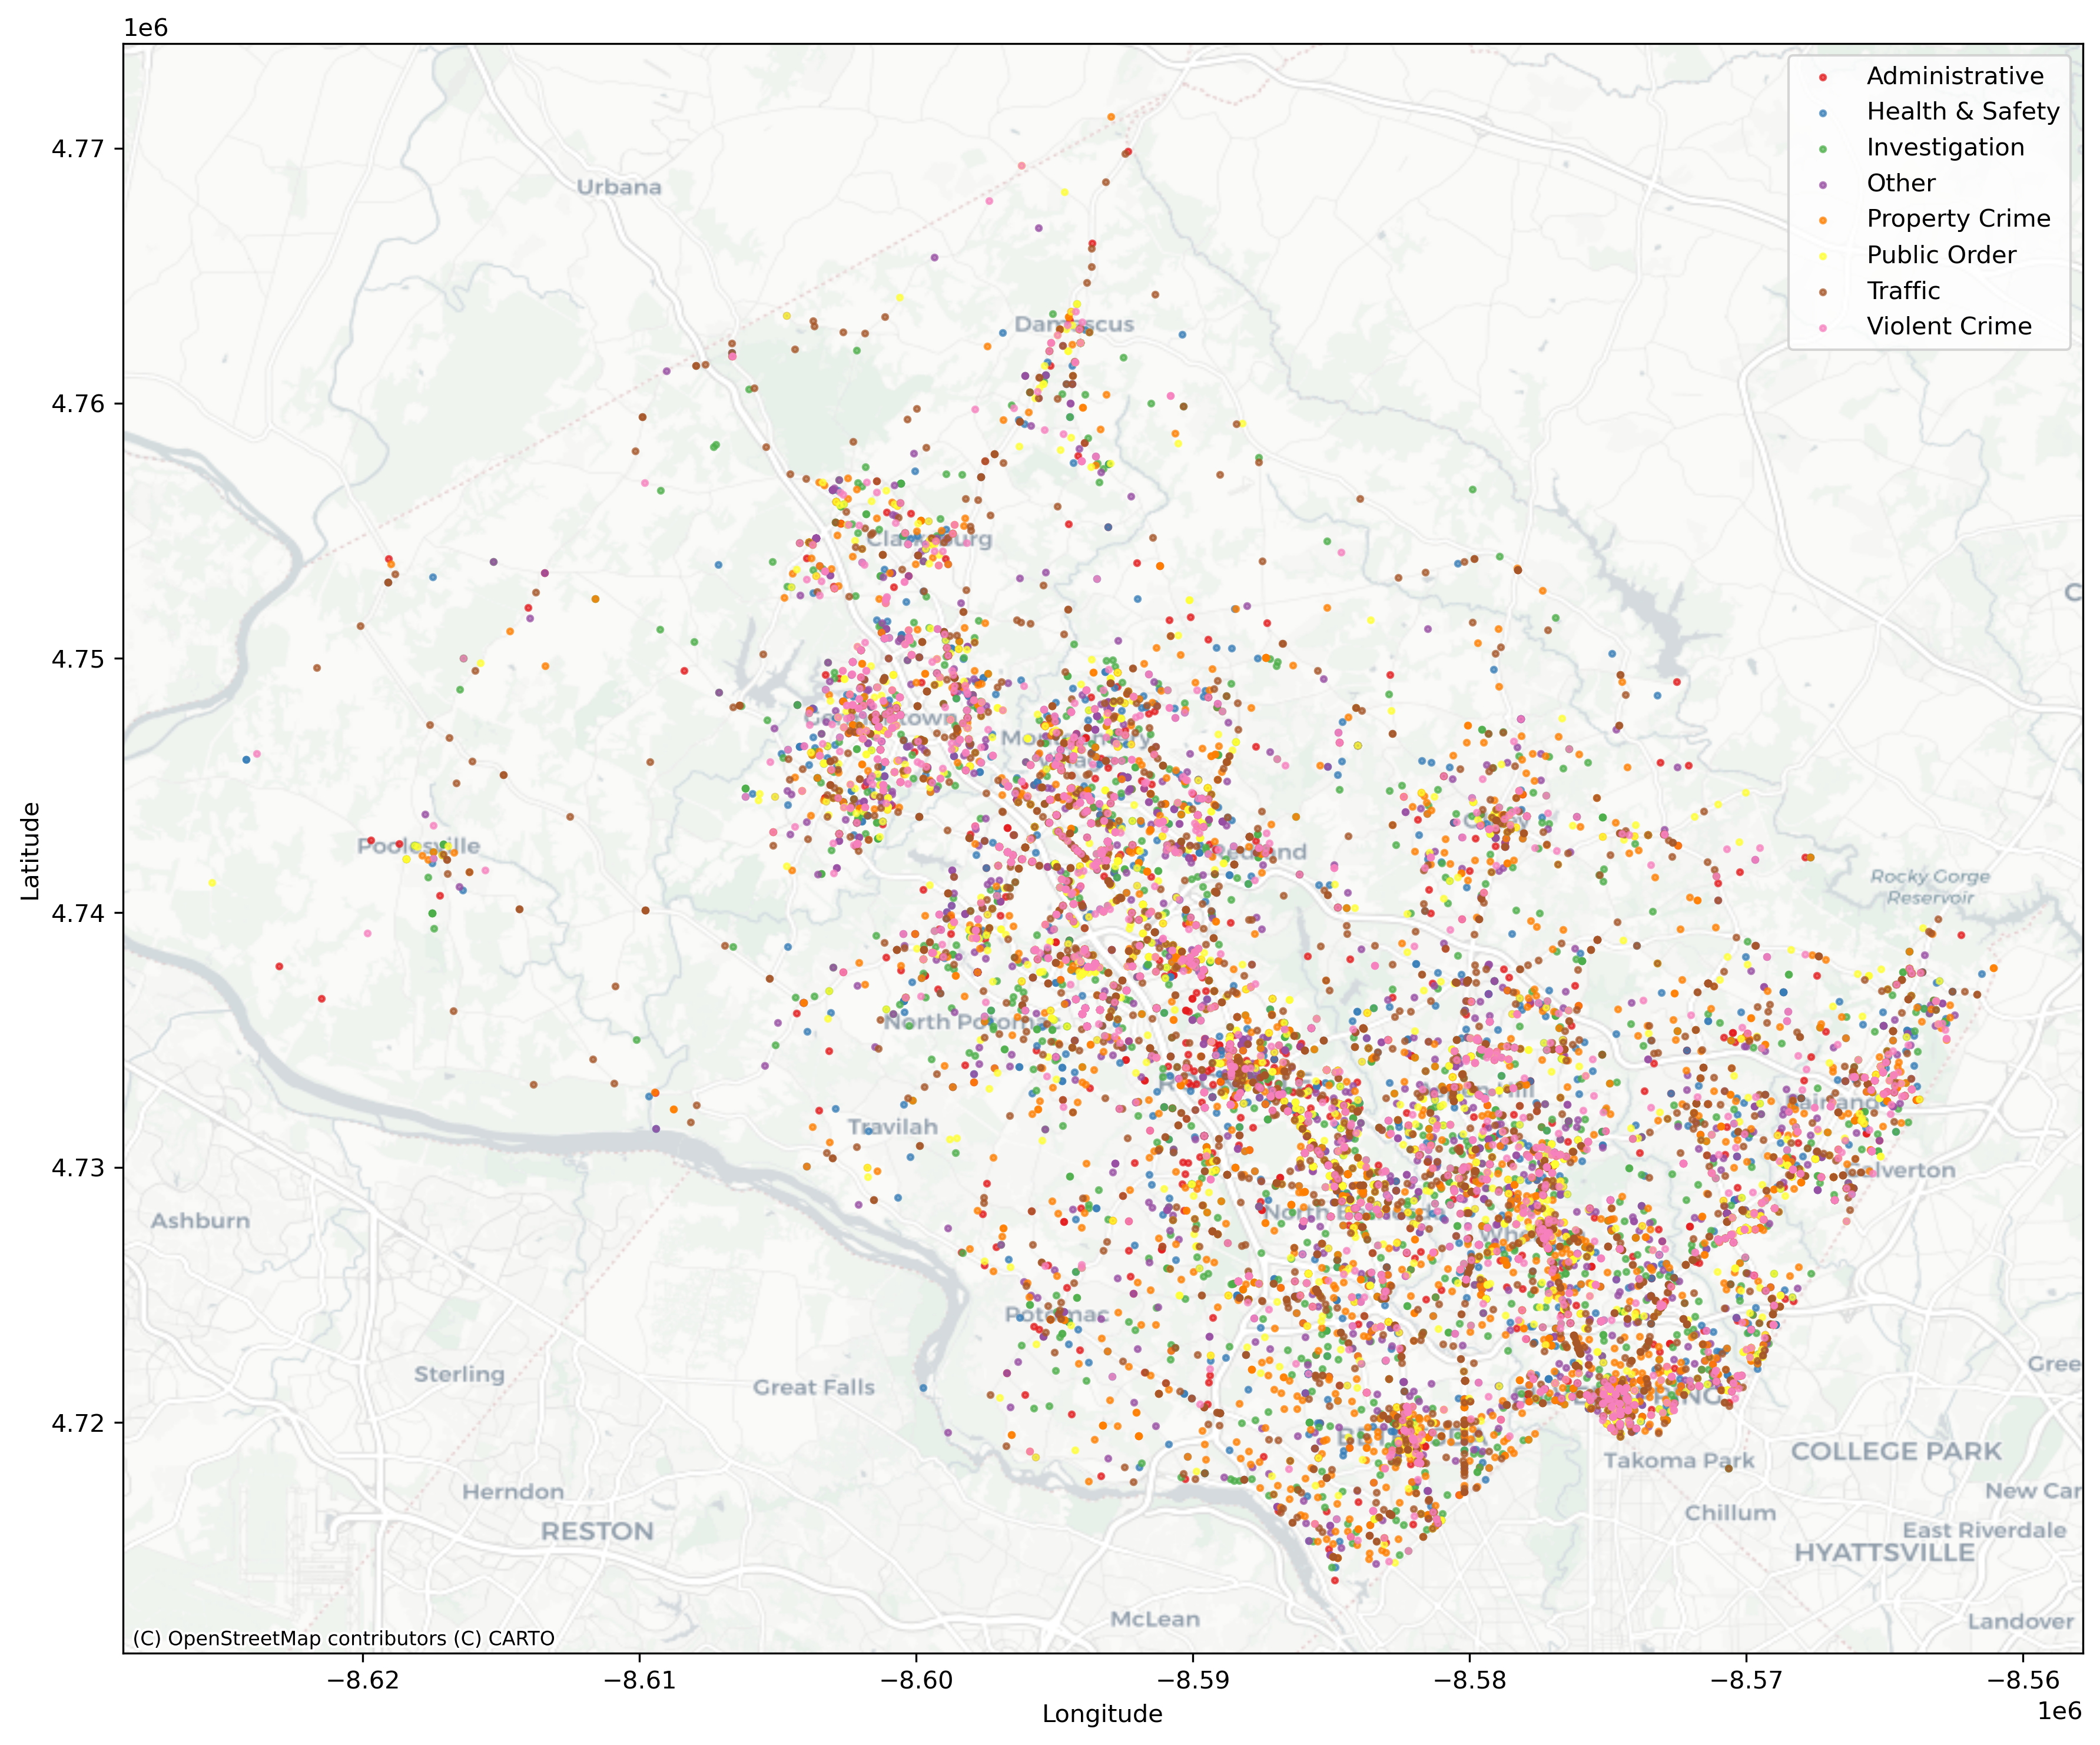
Spatial Distribution of Incidents by Type
Supervised Learning
Three categories of predictive models were built using Logistic Regression, Random Forest, Gradient Boosting, and KNN. Binary classification predicted whether an incident would be high or low priority. Multiclass classification targeted the final disposition code. Regression estimated the continuous dispatch-to-arrival response time.
For priority classification, models achieved reasonable accuracy and recall, though many calls lie near the decision boundary. The multiclass disposition models performed well on common codes but struggled with rare categories due to class imbalance. Response time regression showed that even a simple mean-prediction baseline achieves moderate accuracy — more complex models reduced errors but left significant unexplained variation, capturing broad patterns rather than precise per-incident predictions.
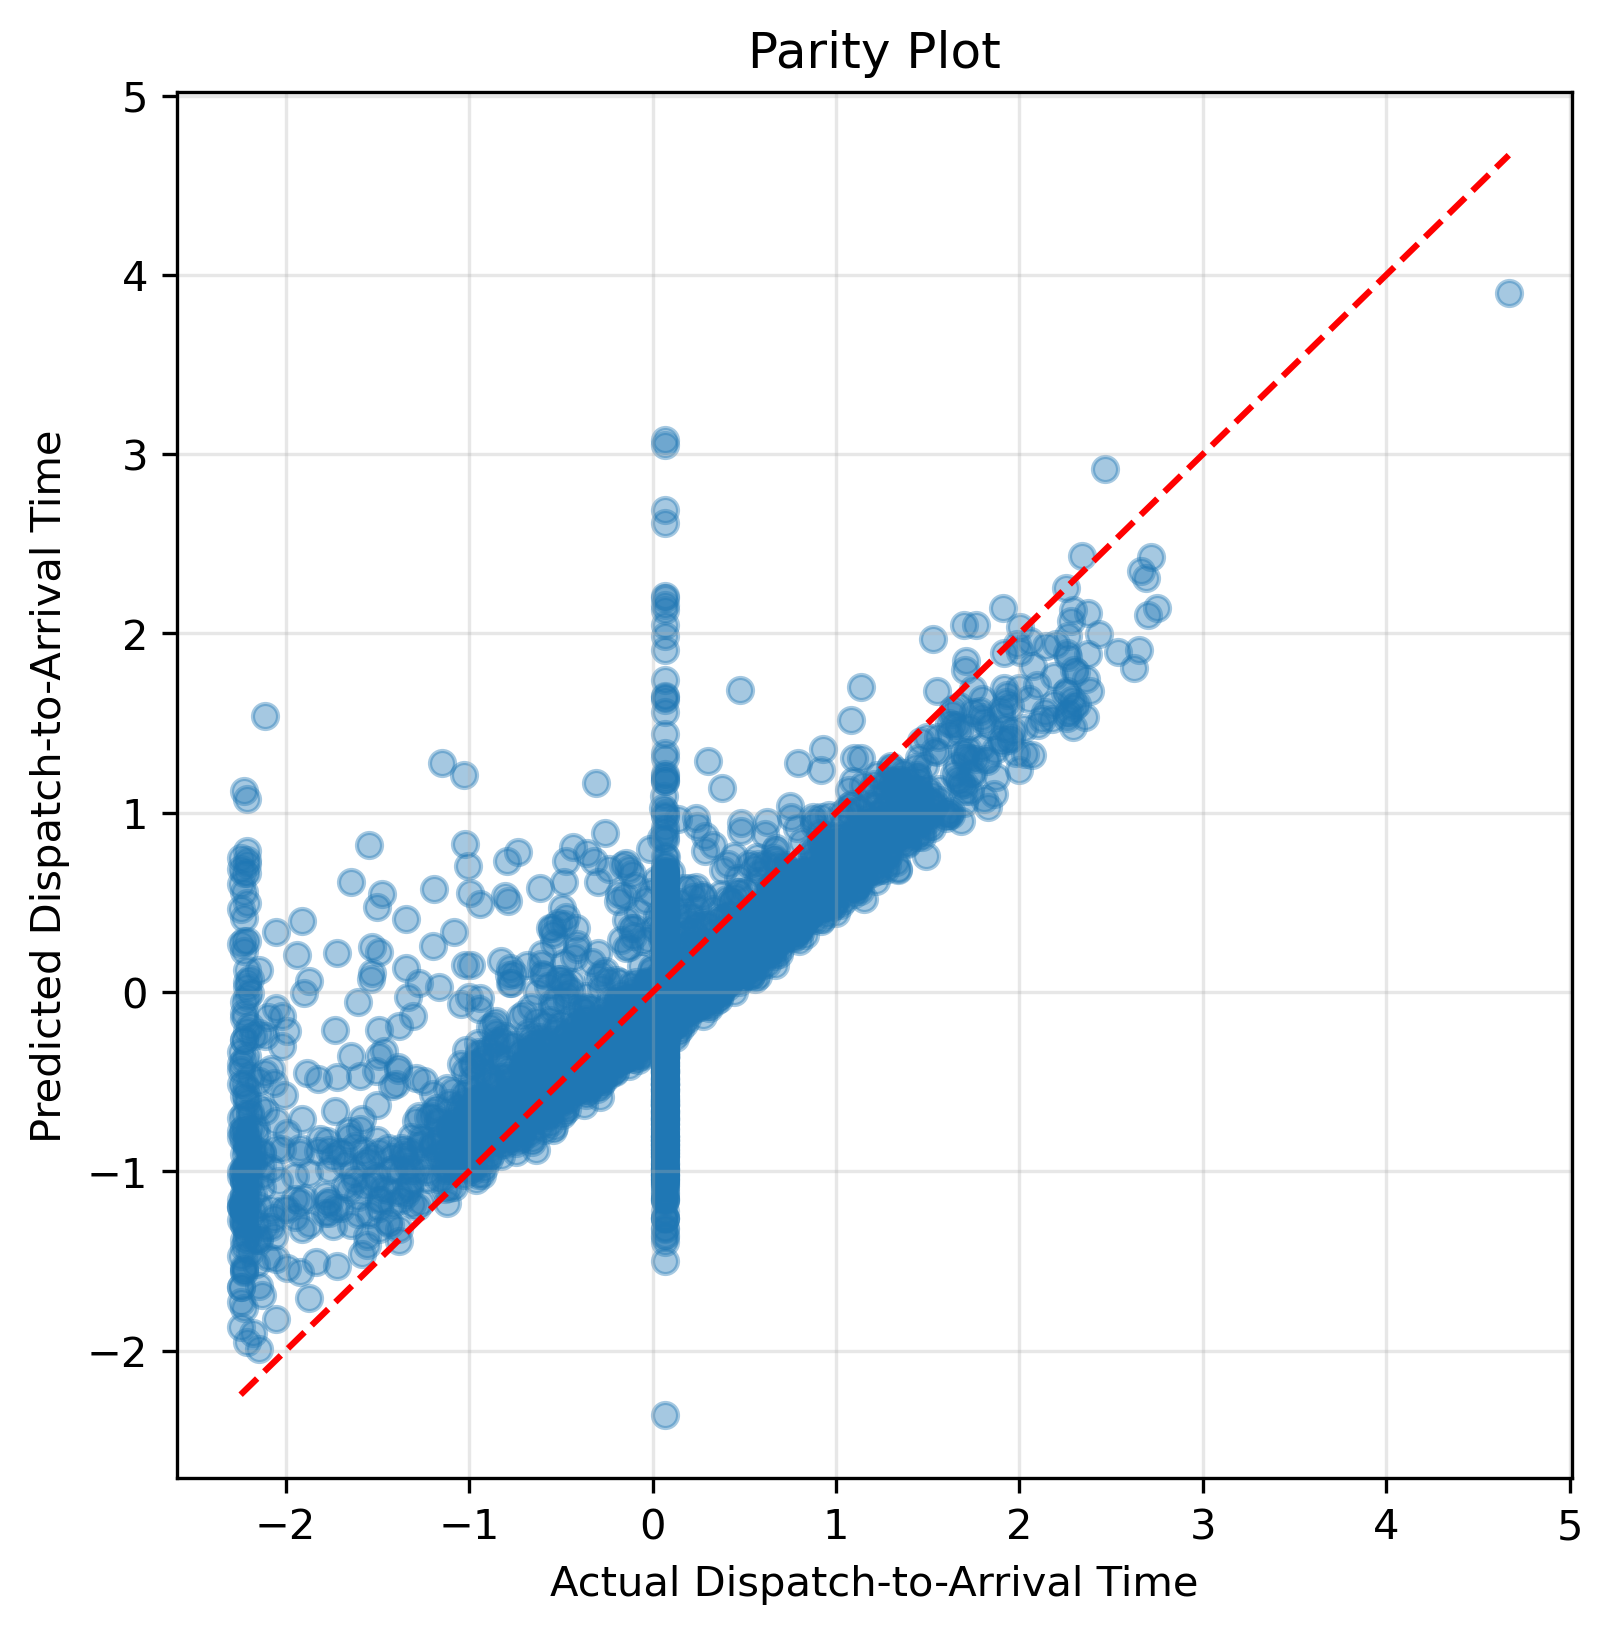
Predicted vs Actual Response Times
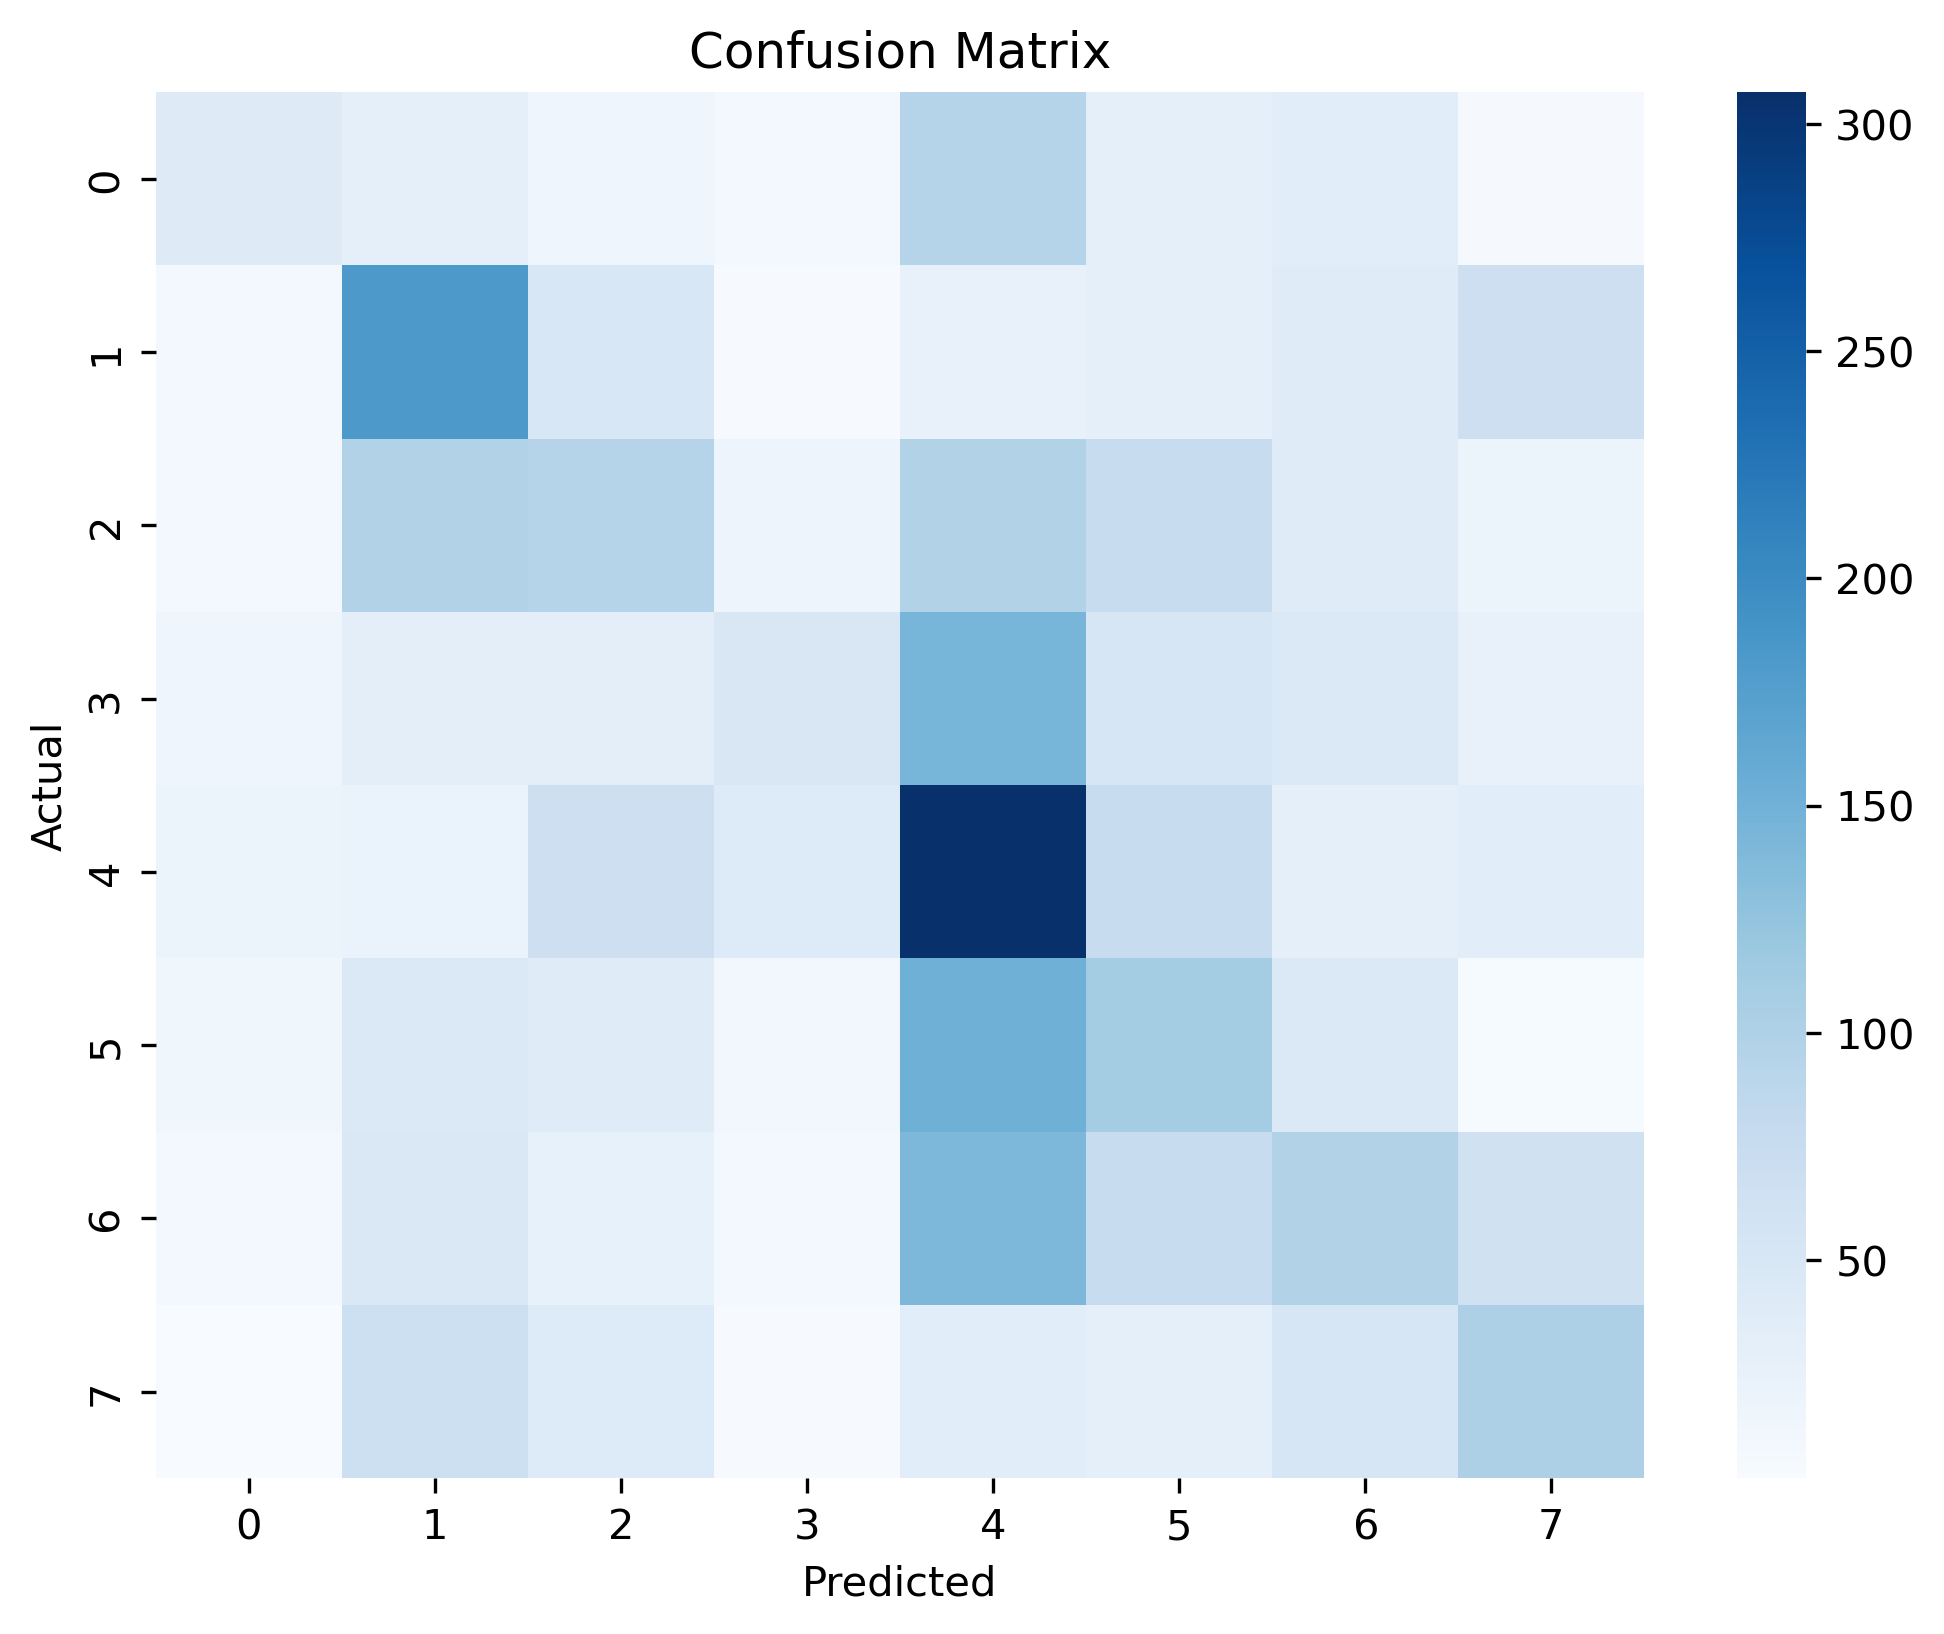
Disposition Classification Confusion Matrix
Key Findings
The analysis surfaced several actionable insights about police operations in Montgomery County:
- High-priority calls have significantly shorter response times with fewer extreme delays, while intermediate priorities share similar distributions and outliers
- Dispatch delays — not travel time — are the primary bottleneck in the emergency response workflow, contributing disproportionately to long total handling times
- Peak incident volume occurs around 4 PM, with public order incidents peaking late at night on weekends and traffic incidents concentrated on workdays
- Silver Spring (3D district) has the highest property crime concentration, pointing to local variation in workload that could inform patrol allocation
- Incidents form a continuous spectrum rather than distinct clusters — response times appear driven by factors unique to each incident rather than broad categories
- Predictive models capture broad patterns but leave significant per-incident variation unexplained, suggesting richer context like narrative fields or neighborhood-level data would improve accuracy
Tools & Methods
- R — data wrangling, statistical analysis, and visualization with ggplot2, dplyr, tidyr
- Python — classification, regression, and clustering with scikit-learn, pandas, numpy
- Quarto — interactive website generation and data storytelling
- Google Geocoding API — recovered missing coordinates from street addresses for spatial analysis
- Montgomery County Open Data API — automated collection of 16K+ incident records
- ML Pipeline — PCA, t-SNE, K-Means, DBSCAN, Random Forest, Gradient Boosting, Logistic Regression, KNN