Drivers of Flight Disruptions at Ronald Reagan Washington National Airport (DCA)
A data analytics project examining factors that cause flight delays and cancellations at Ronald Reagan Washington National Airport (DCA). Integrated 2023–2024 FAA flight operational data with hourly METAR weather observations and holiday calendars, applying statistical hypothesis testing and time series analysis to identify key disruption drivers and build interactive Power BI dashboards for stakeholder decision-making.
Overview
This project investigates the primary drivers behind flight disruptions at DCA, one of the busiest airports in the Washington D.C. metropolitan area. With over 300,000 flight records spanning May 2023 to December 2024, the analysis combines FAA Bureau of Transportation Statistics (BTS) data with METAR hourly weather observations from the Iowa Environmental Mesonet to quantify when, why, and how flights get delayed or cancelled.
Seven research questions were tested using parametric and non-parametric methods — Welch's t-tests, one-way ANOVA with Tukey HSD post-hoc comparisons, Pearson's chi-squared tests, bootstrap resampling (B = 10,000), and ARIMA time series modeling — to move beyond descriptive patterns toward statistically validated conclusions about disruption drivers.
Data Sources & Pipeline
The project integrates three primary data sources through a multi-step cleaning and merging pipeline built in R. Raw flight records from the FAA BTS were filtered to DCA-origin flights, cleaned of inconsistencies, and enriched with weather features and holiday flags.
| Data Source | Description | Records |
|---|---|---|
| FAA BTS Flight Data | Monthly CSV files (May 2023 — Dec 2024), departure/arrival times, delay breakdowns by cause, cancellation codes | 300K+ |
| METAR Weather Data | Hourly observations from Iowa Environmental Mesonet — temperature, wind speed/direction, visibility, precipitation, pressure, humidity, sky conditions | 15+ Variables |
| Holiday Calendar | U.S. federal holidays and school break periods for seasonal analysis | Custom Built |
Flight Delay Overview
Exploratory analysis revealed the delay distribution is heavily right-skewed: the median departure delay was approximately 0 minutes (most flights depart on time or early), but the mean was pulled upward by a long tail of severe delays. Decomposing delay minutes by FAA cause code, late aircraft arrival was the single largest contributor (~35–40% of total delay minutes), followed by carrier-specific delays (maintenance, crew) and NAS delays (air traffic congestion, ground stops).
The probability of experiencing a severe delay (>60 min) rose from 17.10% under normal conditions to 26.87% under adverse weather — a 57% relative increase. Meanwhile, the daily cancellation rate jumped from 0.82% on normal-weather days to 2.65% on adverse-weather days, representing a 3.2x multiplicative increase. Snow events were the most disruptive single condition: the cancellation rate surged to 24.58% on snow days — nearly 1 in 4 flights — compared to 1.45% baseline, a 17x increase.
Weather Impact Analysis
Weather variables were joined to flight records by nearest-hour matching to METAR observations. A Welch's two-sample t-test compared mean departure delay between adverse-weather flights (visibility < 3 mi, wind > 20 kt, or active precipitation) and normal-condition flights. The test rejected the null hypothesis of equal means (p < 0.001), with adverse-weather flights averaging significantly longer delays.
Correlation analysis across 15+ weather features identified visibility (r = −0.18), wind speed (r = 0.12), and precipitation presence as the strongest individual predictors of delay duration. Rain events nearly doubled the cancellation rate from 1.45% to 2.85%, while snow pushed it to 24.58%. Bootstrap resampling (B = 10,000) constructed 95% confidence intervals for the mean delay difference under each adverse condition, all of which excluded zero — confirming the weather effect is robust and not an artifact of outliers.
Research Questions & Statistical Results
Seven research questions were tested with formal hypothesis tests. The table below summarizes each question, the statistical method applied, and the key result.
| Q | Research Question | Test | Result |
|---|---|---|---|
| Q1 | What is the overall flight delay rate at DCA? | Descriptive | P(Severe) = 17.1%, Rising to 26.9% in Adverse Weather |
| Q2 | Do weather conditions significantly affect delay probability? | Welch's t-test | Significant — p < 0.001, Snow Cancellation 17× Baseline |
| Q3 | Is there a significant difference in delay rates between airlines? | ANOVA + Tukey HSD | Significant — F ≈ 441, AA Highest at 12.77 Min |
| Q4 | Do holidays drive higher cancellation rates? | Chi-squared | Significant — χ² = 421, Holiday 2.23% vs 1.52% |
| Q5 | What are the primary delay causes and how do they vary by season? | Decomposition | Late Aircraft 35–40%; Weather Dominates Winter |
| Q6 | Are there significant weekly patterns in delay and cancellation? | ARIMA + ACF | Significant — AR(1) = 0.28, Disruptions Persist Weekly |
| Q7 | Can we identify weather thresholds that trigger disproportionate disruptions? | Bootstrap (B=10K) | Confirmed — All 95% CIs Exclude Zero |
Cancellation & Holiday Analysis
A Pearson's chi-squared test of independence evaluated whether cancellation rates differ across months. The result was highly significant: χ² = 421.26, df = 11, p ≈ 0, confirming that cancellation probability is not uniformly distributed across the year. Winter months (Dec–Feb) showed 2–3x the cancellation rate of summer months, with weather cancellation code (B) dominating the winter spikes.
Holiday periods showed a cancellation rate of 2.23% versus 1.52% for non-holiday periods — statistically significant but with a modest practical effect size. In contrast, mean departure delay was nearly identical between holiday (10.53 min) and non-holiday (10.82 min) periods, indicating that holidays primarily affect whether flights operate at all rather than how late they depart.
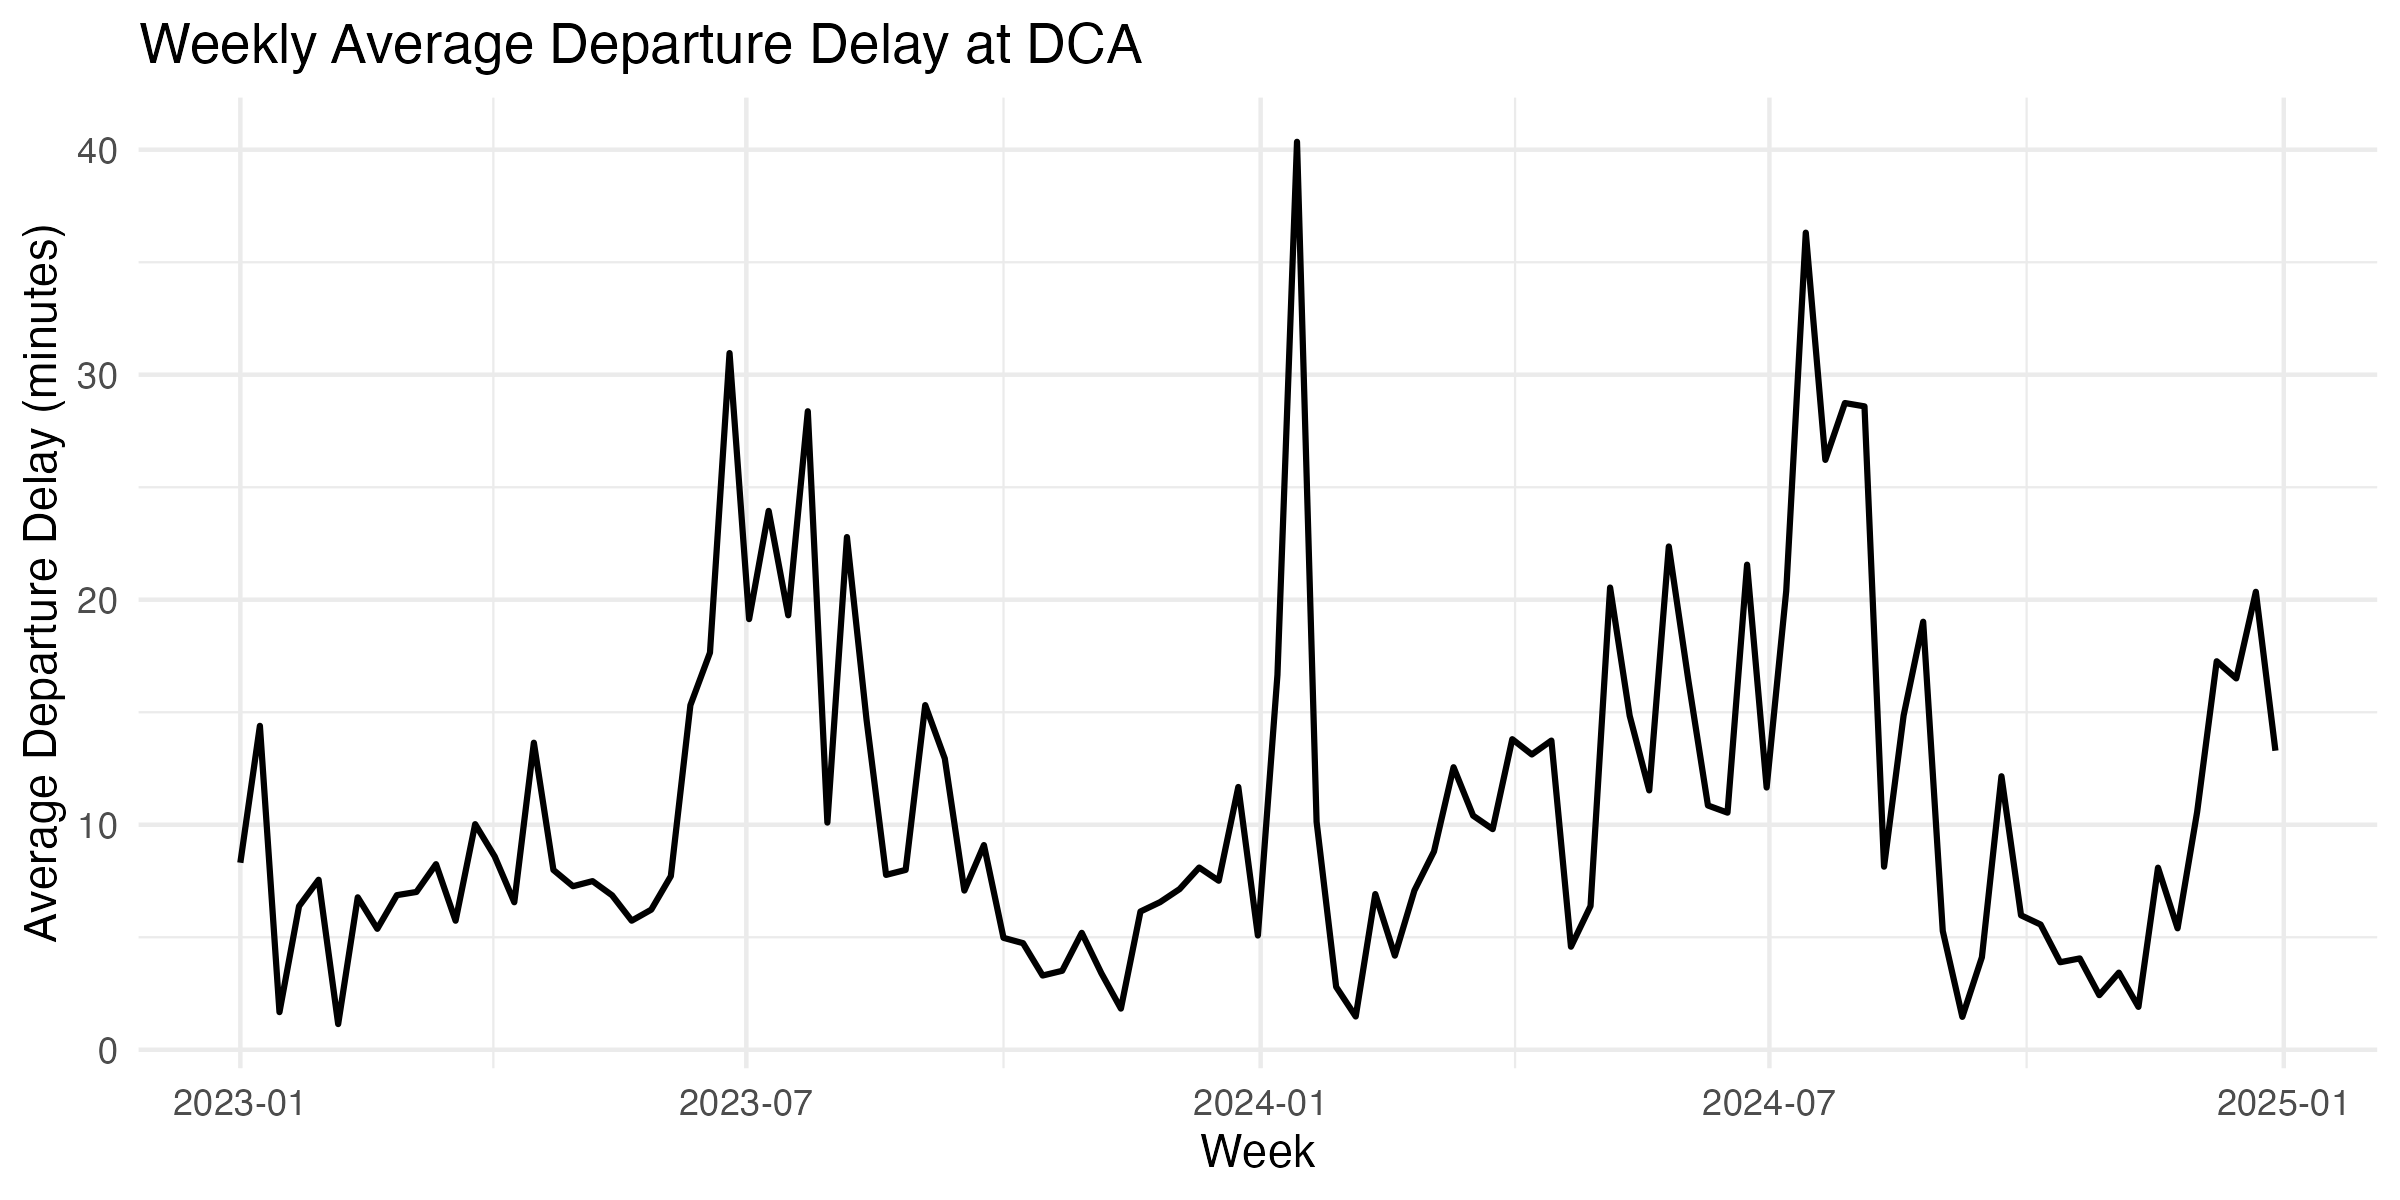
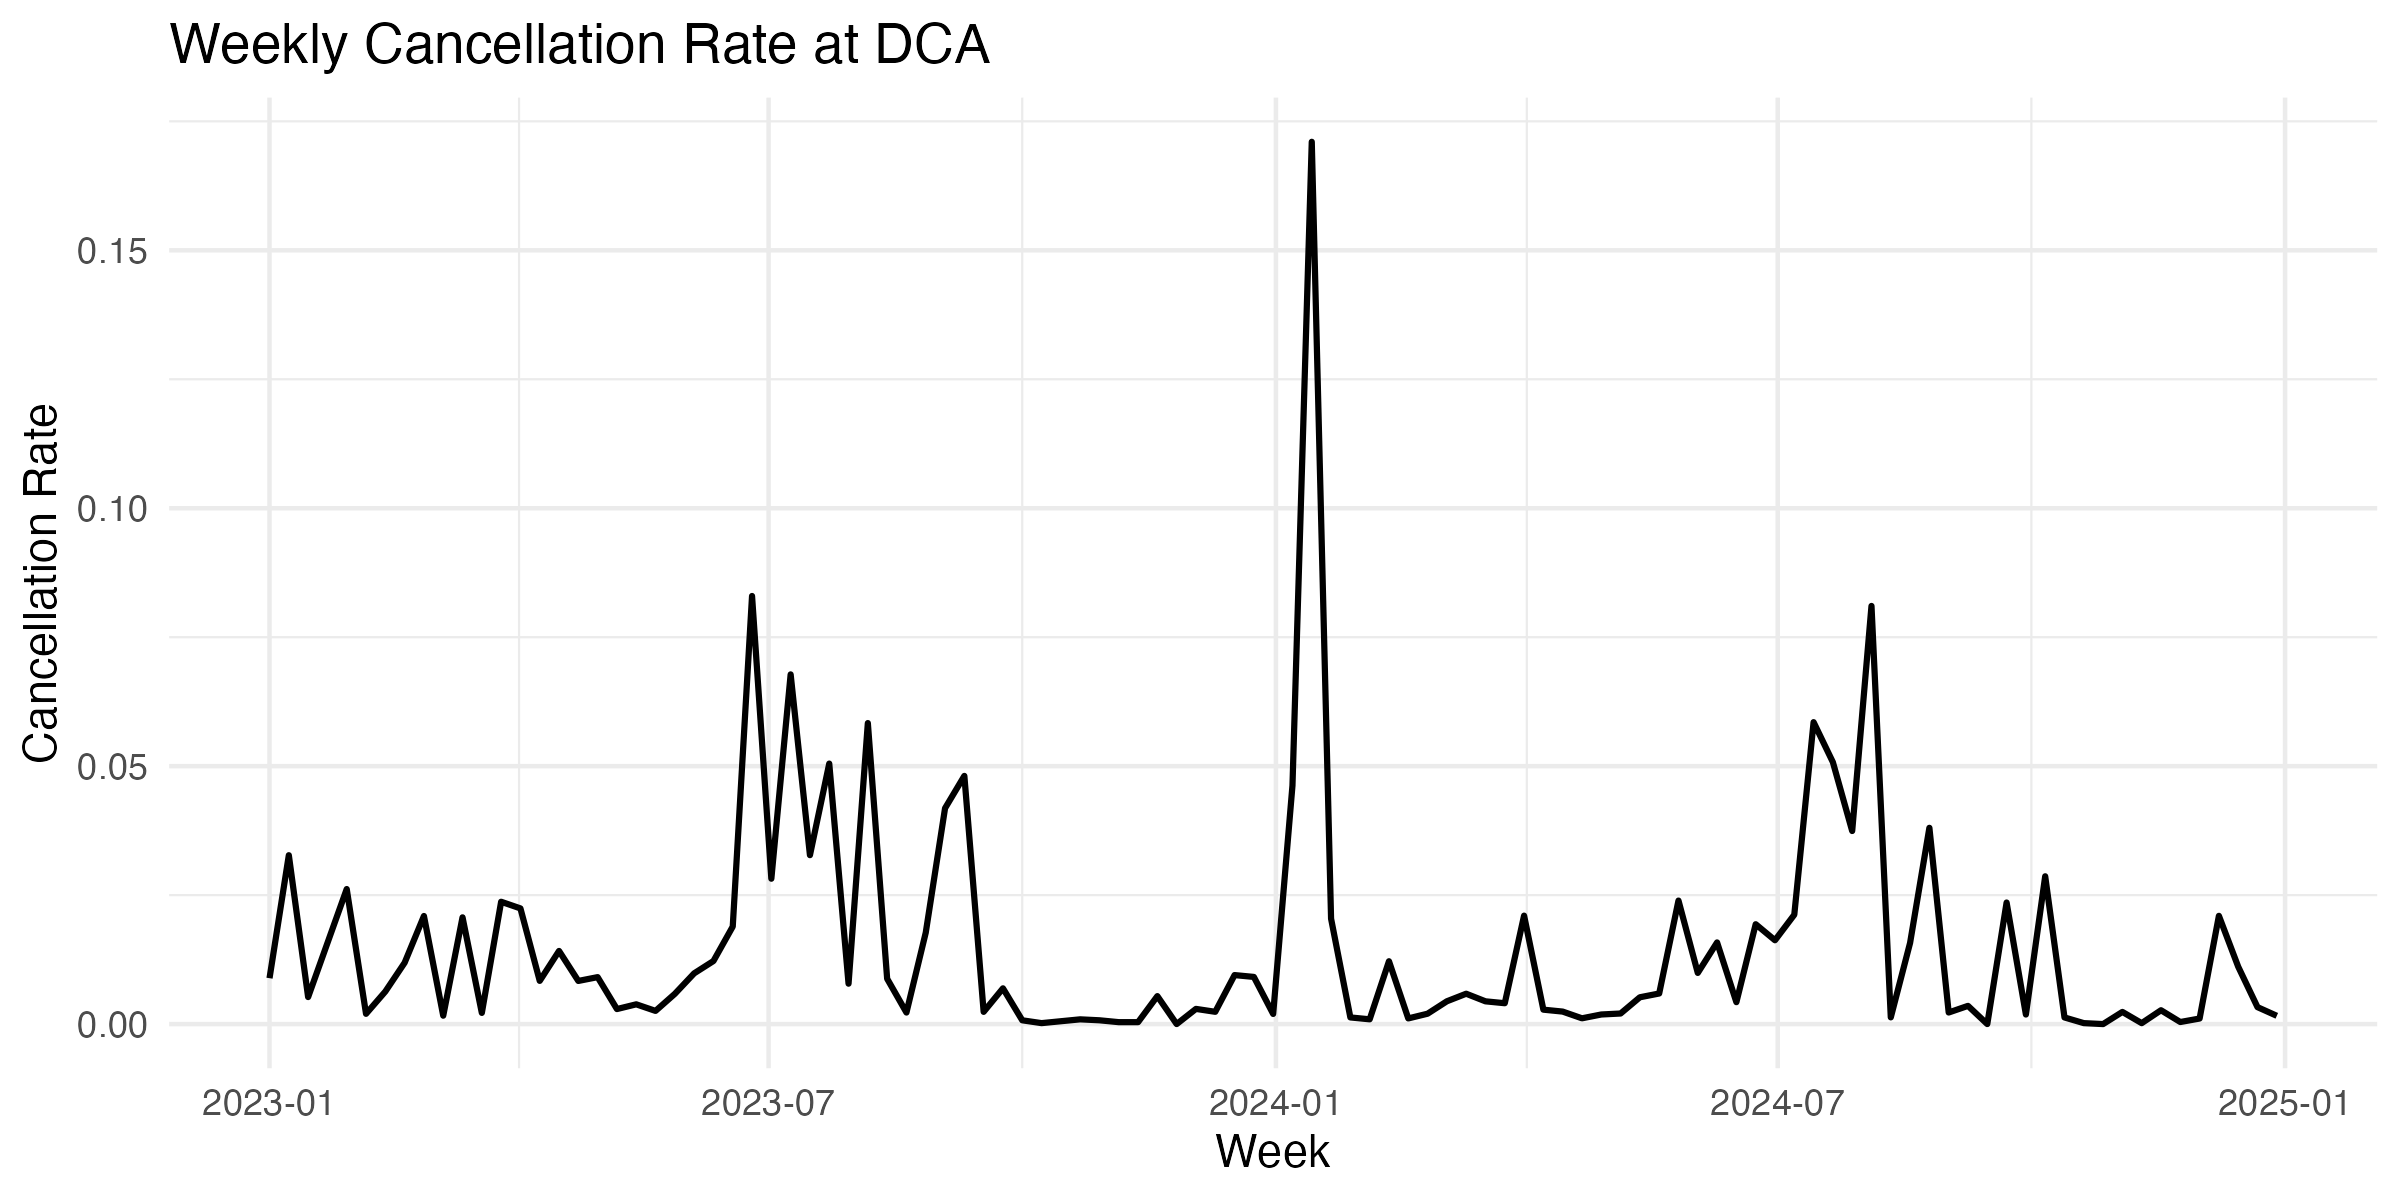
Time Series Modeling
Weekly aggregated delay and cancellation series were modeled using ARIMA. For weekly cancellation rates, an ARIMA(1,0,0) was selected via AIC minimization: AR(1) coefficient = 0.28 (significant), mean cancellation rate ≈ 1.5%, AIC = −493.77, BIC = −485.81. The positive AR(1) term indicates that elevated cancellation weeks tend to persist — a disrupted week raises the probability of disruption the following week.
For weekly average delay, an ARIMA(0,0,1)(0,1,0)52 model captured both short-term shock effects and annual seasonality: MA(1) = 0.26, AIC = 377.25, BIC = 383.16. At the daily level, a seasonal ARIMA(3,0,1)(1,0,0)7 model captured day-of-week periodicity with SAR(1) = 0.088. ACF/PACF plots confirmed significant autocorrelation at lags 1–2 for the weekly series and lag 7 for the daily series.
Airline Performance Comparison
A one-way ANOVA tested the null hypothesis that mean arrival delay is equal across all airlines at DCA. The result was decisive: F ≈ 441, p ≈ 0, rejecting H₀. Tukey's HSD post-hoc test identified specific carrier pairs with statistically significant pairwise differences. American Airlines exhibited the highest mean arrival delay at 12.77 minutes (95% CI: [7.58, 18.95]), while several carriers clustered near the 5–8 minute range.
A chi-squared test on cancellation counts by carrier (χ² = 421.26, df = 11, p ≈ 0) confirmed that cancellation rates also differ significantly across airlines. However, when cancellations were stratified by cause code, weather-related cancellations (code B) were relatively uniform across carriers, while carrier-related cancellations (code A) showed substantial variation — indicating that the inter-airline performance gap is driven by operational factors (crew scheduling, fleet utilization, turnaround efficiency) rather than differential weather exposure.
Bootstrap Resampling & Weather Thresholds
To validate the weather impact findings without relying on normality assumptions, bootstrap resampling (B = 10,000) constructed non-parametric 95% confidence intervals for the mean delay difference between adverse and normal conditions. Three weather thresholds were tested independently: visibility < 3 statute miles, sustained wind > 20 knots, and active precipitation (rain, snow, or freezing rain).
All three bootstrap confidence intervals excluded zero, confirming the adverse weather effect is robust. The bootstrap distributions were approximately normal (as expected from the CLT at this sample size), and the observed test statistics fell well into the rejection region. Combined with the parametric Welch's t-test results, this dual-method approach provides strong evidence that these measurable weather thresholds serve as reliable early-warning triggers for flight disruption escalation at DCA.
Key Statistical Findings
- Snow events produce a 17x increase in cancellation rate (1.45% → 24.58%), while adverse weather overall raises severe delay probability by 57% (17.1% → 26.9%); Welch's t-test p < 0.001
- Airline delay performance differs significantly (ANOVA F ≈ 441, p ≈ 0); American Airlines had the highest mean arrival delay at 12.77 min (95% CI: [7.58, 18.95])
- Cancellation rates are not uniformly distributed by month (χ² = 421.26, df = 11, p ≈ 0), with winter months showing 2–3x the cancellation rate of summer
- Holiday cancellation rate (2.23%) is statistically higher than non-holiday (1.52%), but mean delay is virtually identical (~10.5 vs ~10.8 min) — holidays affect flight availability, not departure punctuality
- Weekly cancellation series follows an AR(1) process (coeff = 0.28, AIC = −493.77), confirming disruption persistence across consecutive weeks
- Bootstrap CIs (B = 10,000) for all three weather thresholds exclude zero, validating the parametric results with non-parametric robustness
Tools & Methods
- R — data wrangling, statistical analysis, and visualization with tidyverse, dplyr, ggplot2, forecast
- Hypothesis Testing — Welch's t-test, one-way ANOVA with Tukey HSD, Pearson's chi-squared test
- Bootstrap Resampling — non-parametric 95% CIs with B = 10,000 iterations for robustness validation
- Time Series — ARIMA with seasonal components, ACF/PACF diagnostics for lag structure identification
- Data Integration — FAA BTS flight records, METAR hourly weather observations, custom holiday calendar
- Power BI & Quarto — interactive dashboards for stakeholder decision-making and reproducible report generation